Fraction Finder Reviews

I’ll make it clear, I do work for arometrix.
I provide assistance to anyone who needs help with their system.

1 Like

I’m posting this on behalf of myself. If anyone is curious about what has fluorescence or not this cheminformatic web server is super cool. It should be used for research purposes only

https://academic.oup.com/bib/article-abstract/22/4/bbaa282/5985287

https://admet.scbdd.com/chemfluo/index/

1 Like

that’s not what these guys used. they excited at 280nm rather than 365nm.

A rapid capillary electrophoresis method with LED-induced native fluorescence detection for the analysis of cannabinoids in oral fluid - Analytical Methods (RSC Publishing)

Method development

Fluorescence emission spectra of cannabinoids

The fluorescence emission spectra of THC and CBD were first investigated to estimate the feasibility of this method. It was found that both cannabinoids emitted fluorescence wavelengths around 307 nm when excited at 230 and 280 nm. Therefore, it was possible to use a 280 nm light-emitting diode with an interference filter 307 nm to detect them in CEwithout the need for fluorescent derivatization. The use of the first λex/λem maximum of cannabinoids (230/307 nm) would provide a higher quantum yield (Figure 1S in supplemental material) and, therefore, detection sensitivity; however, the absence of the commercially available 230 nm LEDs restricted the possibility of their use for this application.

Sci-Hub | Rapid capillary electrophoresis method with LED-induced native fluorescence detection for the analysis of cannabinoids in oral fluid | 10.1039/C5AY01595B

Nor these folks High-performance liquid chromatographic determination of Δ9-tetrahydrocannabinol and the corresponding acid in hemp containing foods with special regard to the fluorescence properties of Δ9-tetrahydrocannabinol - ScienceDirect

2.5. Detection and quantitation

Monitoring with the UV detector was performed at 210 nm for THC and at 272 nm for THCA-A. The fluorometric detector for THC detection was oper- ated at an excitation wavelength of 210 nm and an emission wavelength of 305 nm. Quantitation was performed by the external standard method, measur- ing the peak areas. The signals of standard solutions showed a linear behavior in the range of 0.1 ng to 90 ng for THC (UV and fluorescence detection) and in the range of 0.2 ng to 80 ng for THCA-A (UV detection). The linear model was evaluated by a simple analysis of residuals. For very precise calcu- lations we usually recommend to use only calibration data over two-orders of magnitude, resulting in a narrower confidence interval.

Sci-Hub | High-performance liquid chromatographic determination of Δ9-tetrahydrocannabinol and the corresponding acid in hemp containing foods with special regard to the fluorescence properties of Δ9-tetrahydrocannabinol | 10.1016/s0021-9673(99)01287-x

so at 10x LOD there should also be no signal?!?

6 Likes

I stand corrected he should have signal.
Which he does. Like I said there’s things about his experiment that don’t check out. And with mine I said take it with a grain of salt. But arometrix has done this with Synthetic CRM Standards. I’ve seen quite a bit of field data to know if concentration is going up down or staying constant.

2 Likes

help me understand ̶s̶a̶m̶p̶l̶e̶ ̶o̶n̶e̶ ̶ whoops sample 3 (Color challenged) …

no cannabinoids?
why isn’t that explicitly stated (if it’s true)?

https://arometrix.com/wp-content/uploads/2020/03/In-Situ-Fluorescence-Spectroscopy.pdf

3 Likes

with DISTILLATE, yes. huge signal.

with ISOLATE, I don’t see one I would expect at 10x LOD.
we do see something at 100X LOD.

underwhelming? or just plain looking at the wrong molecule?

edit: and let me reiterate. I WANT this damn thing to work in my use case. just can’t figure out how that’s gonna happen without modifications

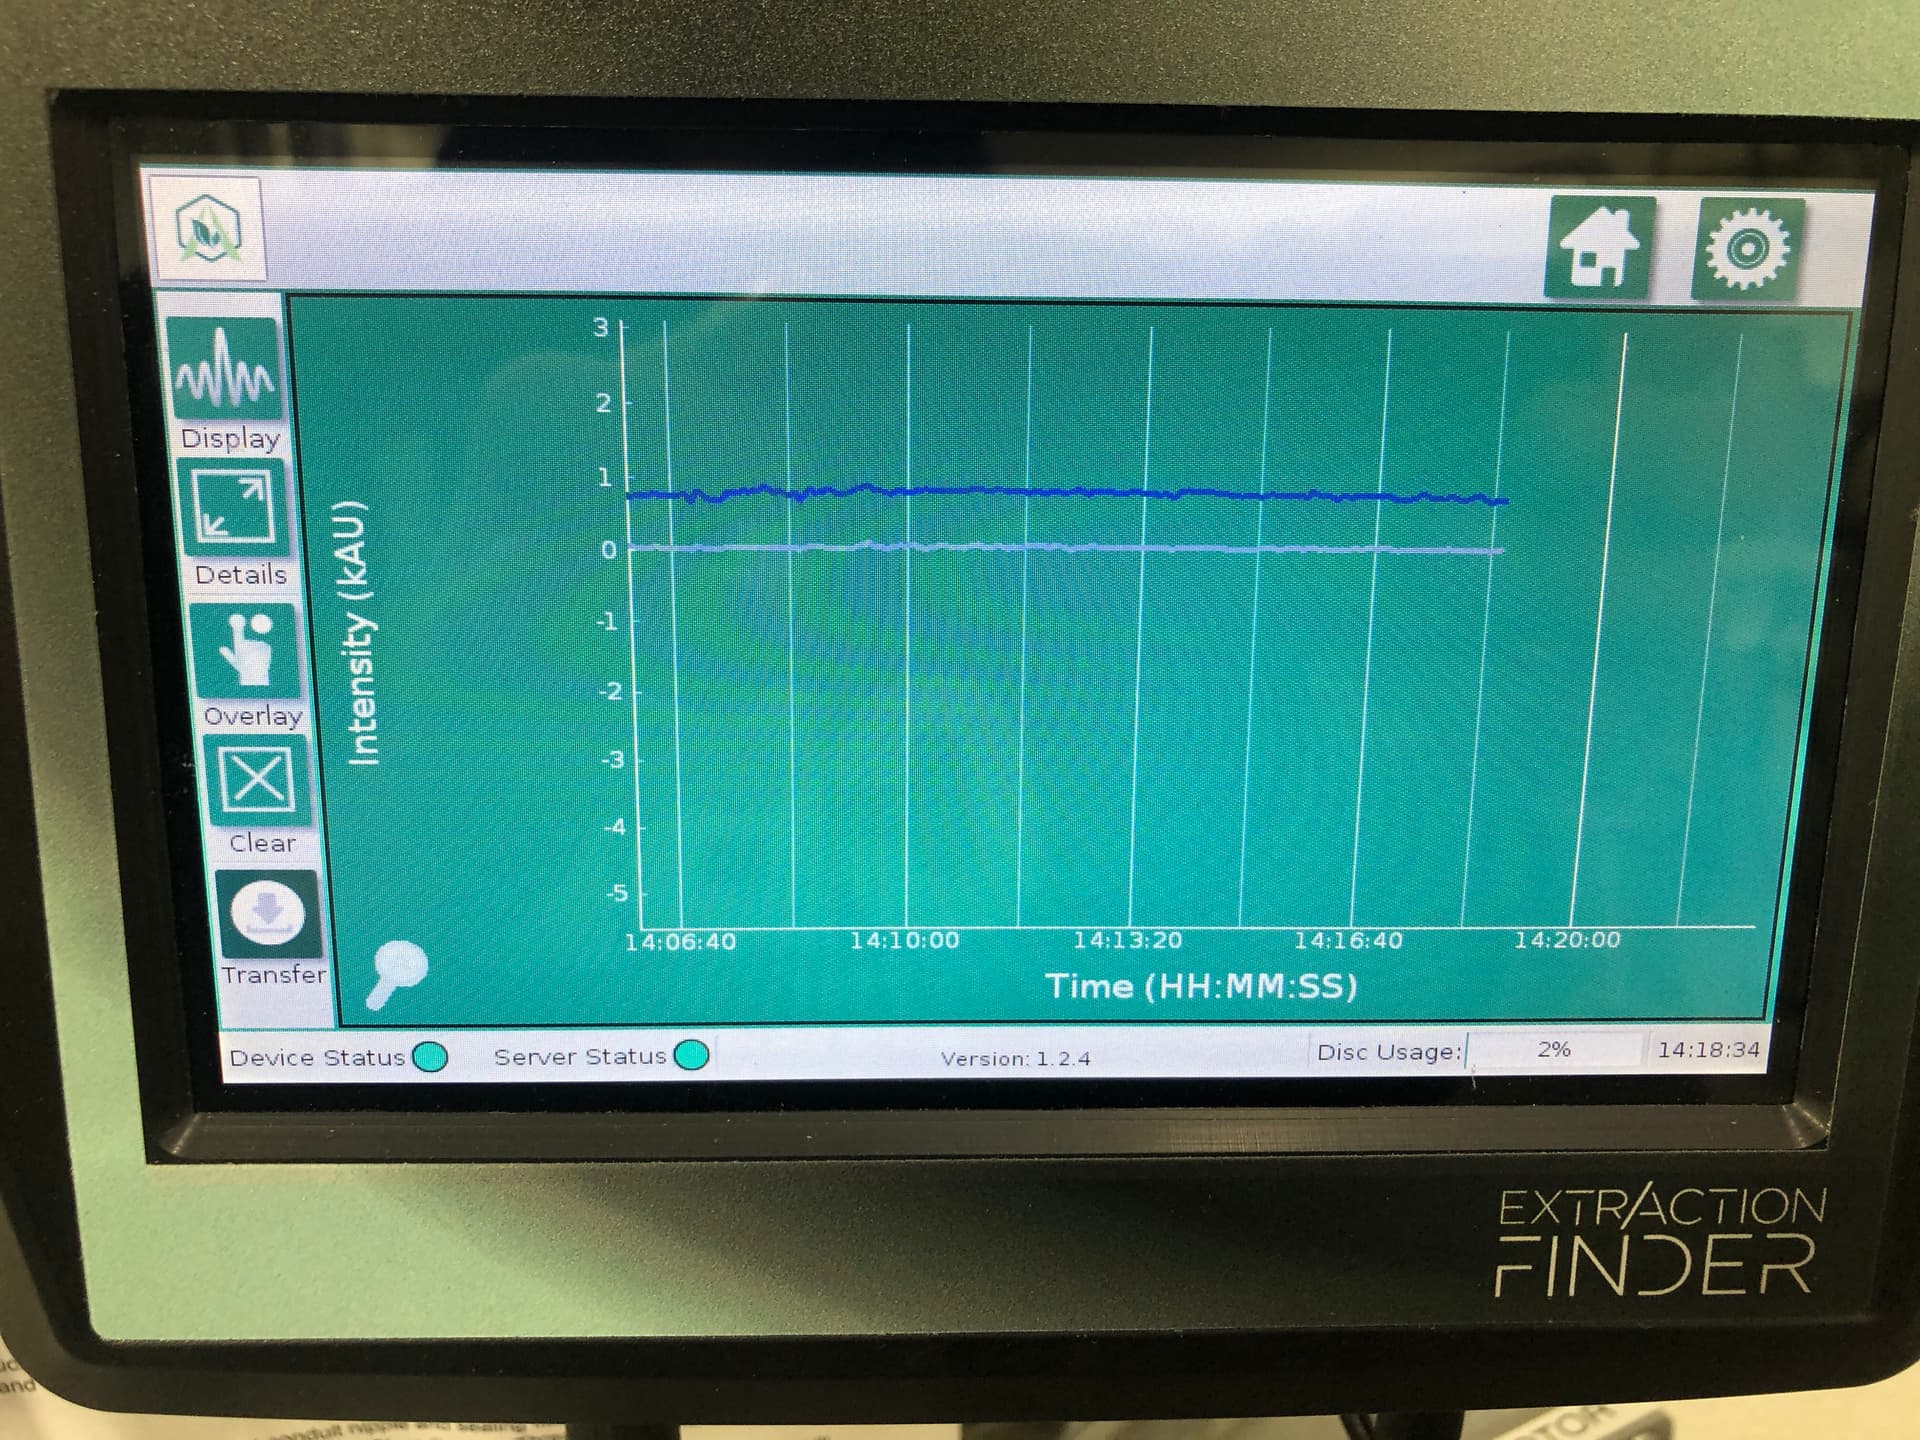
there were cannabinoids in the weed when I started. cannabinoids in the tincture when I was done. somehow they got from point A to point B without detection. which is weird as it was going in circles for 15 min THROUGH the detector.

13 Likes

XD damn I gotta go back and read

The student seems to be the silver surfer on making removals from others get created.

All the while spdking can’t defend himself but usually would try. Areometrix Isn’t a frequent user and all this discussion. Beautiful tried to be deleted discourse attempts while bashing them both.

Nomnomnom

Ah he’s employed dammit. Why they gotta always be affiliated business beefs. At least an employee is speaking for them and going to town.

Bam. Oh my fucking God. You went there hahaha

This hurts to read backwards

Everyone else just sucking it up like omg this guy I know nothing about is writing up a seemingly really technical review. Surely he wouldn’t have any internal angst or issues and doesn’t want to sell anything after discussing.

Sorry man, I just really hate the “fuck these guys I do nothing to solve the problems I claim they have but buy my product!” Flex

Urks me. Something ain’t right about your product either and I don’t think you’ll appreciate the returned reviews. @pigmentfinder

If you haven’t followed. Alex Siegal Spdking and areometrix were once sitting in a tree. K I S S I N G

Now it’s reverted to edited silence and nvm :upside_down_face:

As shown below.

1 Like

Nevermind. Comment away.

More importantly.

2 Likes

So to be clear @silverstudent . You are claiming that the device SHOULD have been able to detect 0.2g CBD isolate? And that there is something wrong with his system? Can you substantiate that by showing what it looks like on yours?

3 Likes

I repeated @AlexSiegel’s experiment.

Blank (denatured ethanol), 20mg THCA isolate, 200mg THCA isolate, 240mg “distillate”. In 20 ml denatured ethanol

Red line is distillate, black is isolate. Just to show I loaded the same amount (peak shape is atrocious because that’s 5x what I would normally load).

Really can’t see a signal with 20mg THCA in 20ml. You can see 200mg. (10mg/ml)

3 Likes

Most likely the signal from the THCa is the trace pigment trapped inside the crystal

A more comparable test would be to show 200mg of THCa vs 200mg of HTE (mother liquor source). The pigments in the HTE will make it very clear that the signal from the THCa is just less of the same pigments

2 Likes

THCA came back at 100% THCA, 1.5% THC & 1% terpenes. :shushing_face:

And yes, it absolutely shows a little color.

44mg HTE vs 20mg of Isolate.

Spiked my blank from above with the HTE (44mg in 20ml) pulled from the same (hydrocarbon) extraction the THCA was pulled from.

my math says they’re pretty comparable concentration wise.
I’ll get overlayed GC traces tomorrow.

Edit: GC trace. Red is 1mg/ml “THCa isolate”. Black is 2.2mg/ml “HTE”. Sample that shows higher signal on fraction finder has LESS cannabinoids….

Caveats: HPLC would show 10-15% decarb in the HTE (at a guess).

Here is the spectral trace for the HTE. You can see the “lipids”…(those don’t fluoresce either).

3 Likes

That’s badass that you can provide side by side data between the fraction finder and the SRI GC. Which honestly begs the question, why in the world someone would spend the money on the FF when it’s already priced within GC price points. I get that “magical” detection of noids in toobs would be much more streamlined for continuous processes, but it really makes you think that the tests you are doing prove that the FF produces qualitative results at best. Above all else, the fact that this data had to be dredged up by someone who has both pieces of equipment (and is not associated with the mfg) smells a WHOLE lot like a company that wanted to recoup r&d costs on a product that does not do what is advertised (give a quantitative measurement of various noids)

8 Likes

without an auto-injector, the dozen or so injections + 11min run times is a whole lot more work that having a device that could inform my operator(s) when the task was complete.

I’m NOT going to sample every min during extraction for every extraction, so I can dial in a particular biomass, but can’t switch that up on the fly and expect the operator to achieve perfection.

Ideally I want a device that I can integrate into the control system on my fuge. so I push go, and it decides when the extraction is complete.

which was why I was over the moon when Arometrix told me they could build such a critter.

and lets be honest here, following pigment as a proxy to track extraction is absolutely why we get folks doing month long soaks to make RSO. It’s getting darker. so it must be extracting more. the fraction finder is not an un-useful device. it just isn’t tracking what I’d hoped it was, and I’d rather not use a proxy for my cannabinoids if I can avoid it.

7 Likes

on the fly data is a lot more useful than 5-30 minute results. especially when your extraction process is less than 30 minutes total.

3 Likes

So after reading the responses, it is absolutely clear that such a device would be groundbreaking for processors that want more resolution in their data sampling frequency especially in processes that can’t easily be sampled such as SPD. I too am aware of the caveats of sample workup with the 310MM and its lack of built-in autosampler. I was really intrigued while reading this thread and the others regarding the various units created to fill the gap. My gripe was mostly with the fact that all of this data should have been made available for people before they dropped that kind of money on it. Take for instance SRI, not only did they supply chromatograms for various cannabinoid samples but also the videos and information required to get off the ground with their units. I have yet to see any claims made by SRI about their equipment be debunked (which is why I bought one). Why is it acceptable for the Arometrix to make bold claims about cannabinoid UV fluorecence detection just to come to light that its the pigments that are actually influencing the detector? Like the tests that @cyclopath has done should have already been done and published by Arometrix as an example of what a real world test might look like for your average user.

11 Likes

Agreed 100%

Just glad i didnt pull the trigger on the c1d1 model and throw away another 9 grand. I was about a day away from buying it too.

4 Likes

Link to their peer reviewed paper above…and below.

We use proxies for figuring out what’s going on in all sorts of applications.

I’ve long used color to figure out how my extraction is progressing, we all have…

I haven’t used a fraction finder on a distillation yet, but I’ve got two SPD set up to do just that.

Curious to see what they see.

Reasonably sure at this point that whatever IS fluorescing in the 420-440nm range is not co-extracting with THCa or CBDa in ethanol between -40 and 0C.

The Fraction Finder has always called “done” early.

I interpret that as either the actual fluorescent compound extracts faster than the cannabinoids, or there is a limited amount that extracts in ethanol in the temperature range I’ve explored.

Dunno.

Moving on…

2 Likes