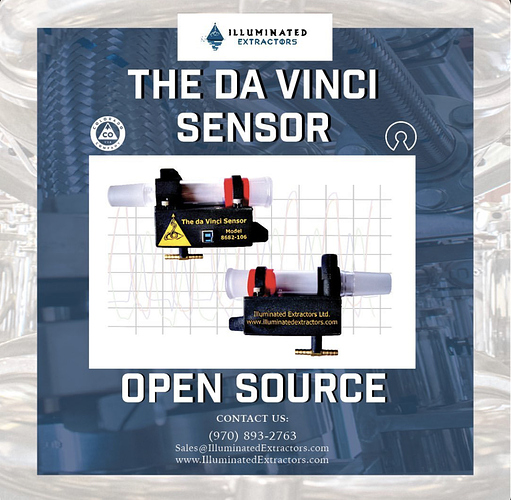
Hi, my name is Zack and I am the inventor of the DaVinci Sensor. If you have any questions about how it works, I would be happy to answer them!
I initially started with the route of a true HPLC sensor but fell short in trying to attach the required equipment to a SPD and decided there might be another route to take. Yes, it is true that our system operates in the Visible Light spectrum of 380nm (UVA) to 750nm (Near IR / Deep Red) which includes all other visible light colors such as blue, green, yellow, orange, etc. I found a unique way to utilize the red, green, blue, white combination that enables us to reverse calculate individual wavelengths based on the ratio of the base components. We use a matched source light and receiving detector that is then calibrated to each base wavelength and the environment, to which then, we can see mixtures of light spectra that would otherwise have been seen only as noise. It is not as accurate as a diffraction grating style system with a linear detector array by all means, but it still gives absolutely amazing results. With this technique, we can identify ethanol from water so long as the majority fraction is either ethanol or water.
To properly identify Cannabinoids with UV, one would need a deuterium lamp (or similar broad-spectrum source) and UVb/UVc range diffraction grating along with some other sophisticated equipment, finely tuned, in a completely light free environment using absorbance spectroscopy. This would be extremely difficult on a SPD, not to mention that all of the fractions would bleed together and all appear as one. (And won’t work with glass - not to mention path length issues). Therefore a chromatography column is used prior to such a detector, to isolate individual cannabinoids first prior to analyzing them. For these reasons, I chose to go with a simpler approach to where I then used a Visible White Light (with a good broad spectrum) and a matching detector that can easily see differences of intensity between 0 and 100,000 points! With that in mind; 100,000R * 100,000G * 100,000B = 1,000,000,000,000,000 detectable combinations!!! From this we can then reverse calculate the would-be mixed color that is currently being detected, based on a known Wavelength to RGB function. Which we then take 100 samples every 3 seconds and plot the resulting peaks in our Fast Fourier Transform plots. The Raw data plot is updated 50 times per second if you are interested in seeing exactly what the sensor is seeing.
Finally, UV Fluorescence data for cannabinoids is very convoluted as most cannabinoids appear the same with slight subtle shifts right or left and possibly an extra peak or two. Compared to Absorbance Spectroscopy, which uses the absorbance of individual wavelengths to identify the molecule’s spectra (the same tech used to see what gasses are in other planets, etc.) and can easily identify the products concentration based on the Beer-Lambert Law so long as you have a proper calibration curve with a good R2 value > 0.9995, and so long as you can actually detect the present wavelengths. Due to the detection limit of our sensor, many years leading up to release and the years since of research and development that has been put into our unit, identification of light volatile terpenes vs heavy terpenes, main body fractions, tails, bottoms, can easily be detected with our sensor and more.
We also have options to track head, mantle, and room temperatures along with vacuum percent. This data can be used along with the known boiling points and Heat of Evaporation values of cannabinoids to find what should be boiling under what conditions. Combined with the starting material’s COA, we plan to add a plot screen to show would be potential fraction content. This is a much more in-depth portion of our software that is still in development and is partially introduced with the soon to be released Open Source DaVinci Sensor.
Our circuit is 100% completely custom designed and coded by myself. Schematics and all programming source code will be included in our Open Source release!!! Everything is commented extremely well!!! (There might me more comments in the code than there is actual code).
Documentation is supplied with the system, we previously kept it off the internet to prevent reverse engineering. We are in the process of updating our webpage and need to re-create the DaVinci section.
Cheers!
![]()
![]()
![]()
![]()
