I wanted an easy way to automatically, in real-time, measure, log and analyze equipment process metrics in order to learn from and improve efficiencies. Built on existing ‘off-the-shelf’ tools and a little custom software, I’ve put together a quick way for any lab or researcher to quickly digitize their existing lab equipment for active monitoring and analysis. Where my previous threads talked about specifics of hardware or software, I’ve put together this thread in hopes of explaining and providing the entire stack of software and hardware tools for free to others in the industry that can benefit from them. (All software and hardware documents can be found in the github link below)
Since I was starting from my personal interest to improve my short path distillation skills, the following example is monitoring a short path distillation system but can be applied to any set of devices, sensors, or metric. I’ve successfully used this system to monitor my short path many times as well as a custom made freeze dryer, co2 extractor, even my rosin press; anything we can apply a sensor to. In the case of the spd, I was able to get a stronger sense of what was happening to my head temps so that I could learn to cut better fractions. Instead of single data points, I was looking at data trends over time and could apply that to my operation.
**Please note that the following is a high-level technical guide to quickly get someone started with monitoring equipment metrics. This is in no way a fully secured, commercial grade, software solution but if that is something you seek, ( ![]() ) I am currently available for work or consulting and looking for interesting projects if anyone is in need of custom software/firmware, circuit/hardware design, 3d design, or other computer engineering concern. Happy to provide more background and references for my skillsets.
) I am currently available for work or consulting and looking for interesting projects if anyone is in need of custom software/firmware, circuit/hardware design, 3d design, or other computer engineering concern. Happy to provide more background and references for my skillsets.
With that out of the way, lets talk about the software. The software stack utilizes 4 applications: Grafana, InfluxDB, Mosquito, and a custom node application named mqtt2influxdb. The overall idea is that your hardware will be sending messages over wifi to the MQTT broker, Mosquitto. The custom node application then takes the information from the MQTT broker and stores it in a database, InfluxDB. From here, we are able to view the time series data from a web browser logged into the Grafana interface. To get started, follow these steps:
- Install Docker and docker-compose
- Download git repo: https://github.com/dp621/connectedlab
- Docker-compose up in the folder
- Open browser to http://localhost:3000
- Login with admin/password
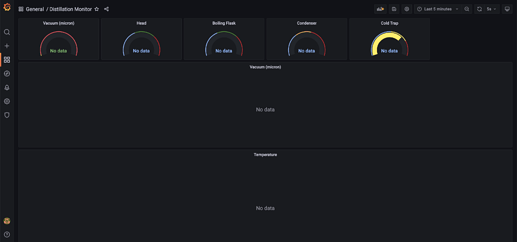
Congratulations! You now have a working software stack. Your new stack has been preconfigured with a database connection to influxdb and a fully working distillation dashboard that looks like this:
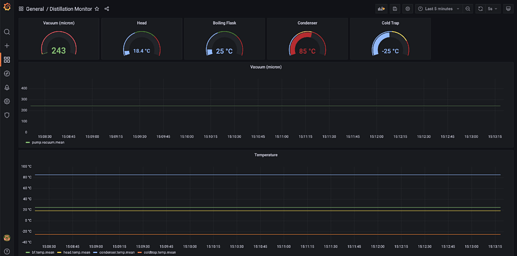
Don’t worry that there is no data available; now is when we can connect hardware devices to our system or run a simulated test using the provided tools. By running the provided node test application, spd_test.js, data is automatically sent to the MQTT broker as if a hardware device came online. Your distillation dashboard should now look like this:
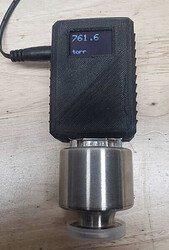
For those that have been following this adventure, you have probably already seen my custom built vacuum monitor that reads mks 901p sensors. Since my last post here, I’ve made one final change to the device giving it a built in lcd display so that it can be used with or without the ConnectedLab software stack:
Complete schematics, circuit designs, firmware code, and case designs can also be found for immediate use in the above linked github repo under the /devices folder. I managed to order way too many circuits and parts so if you are in need of parts, a kit or fully built unit instead of sourcing the parts on your own, feel free to reach out in DM.
Any questions on the software stack reach out below!


