@Plant2pipe That wasn’t me. Who are you quoting? Sounds quasi-correct, whoever it was.
didnt mean to imply it was you and its out of a patent.
No worries. Just wondering where you saw it. PM me if you prefer?
not trying to keep it secret it was just already posted it and didnt want to spam https://future4200.com/uploads/default/original/1X/c01679aa06b4bc41c1844322905bdb674b90d1ff.pdf
1 Like
Thanks! No worries. Cross referencing on a web board can get confusing, and I doubt a useful link would ever be considered spam! Cheers! 
1 Like
im srry that quote isnt actually from the patent directly its from this websites overview of that patent Pure THC and CBD - Green Chemistry - Hemp Hacker
Ah. Makes more sense, now. Thanks!
Where would THC-O-Acetate show up on a Chromatogram? Speaking of mystery spikes
2 Likes
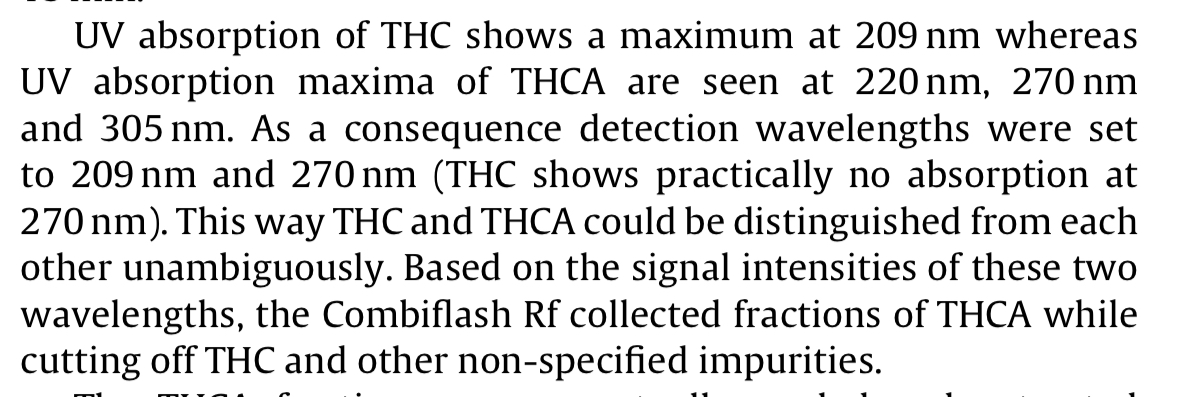
I don’t believe you can separate THC from THCA by setting collection for 270nm. They both have large absorbance near that value. Where did you find this? If anything, the separation was due to the chromatography method, not due to telling the system to collect when high 270nm absorbance was detected.
@SoStupendous
Here is the link for the reference I posted
https://www.researchgate.net/publication/51671990_Rapid_isolation_procedure_for_D9-tetrahydrocannabinolic_acid_A_THCA_from_Cannabis_sativa_using_two_flash_chromatography_systems?_esc=publicationCoverPdf&el=1_x_2&enrichId=rgreq-2a15bb9b633b399c058c5479c901f43f-XXX&enrichSource=Y292ZXJQYWdlOzUxNjcxOTkwO0FTOjU2NDU3OTg1NjAyMzU1MkAxNTExNjE3NzM1ODQ4
1 Like
Huh. I’ve read that paper before. It might be that their use of formic acid changes absorbance spectra (just a guess). In any case, I have observed THC to absorb in that range. They didn’t cite anything so presumably this is from their own direct observations.
1 Like
Having just called out @1244farms on their CBD distillate testing at ~11% CBC, it occurs to me that CBD might not degrade/isomerize via the same compounds…or even “is unlikely to degrade in an identical fashion”.
They also report CBC in the starting biomass, so my current working hypothesis is I was wrong (doh!).
now that I’ve back-pedalled, deleted my comments, and mostly apologized, I was wondering what others thought.
I’ve not seen CBC levels matching those in the biomass I’ve worked with, but maybe others have…
2 Likes
I have recently had a large homogeneous 90kg toll run test at 5% CBC from biomass that had .84% CBC the random samples we took.
The later run oil samples tested at normal levels so it appears that it was just a hot load of a high CBC phenotype that we missed in our samples.
I have had this happen with THC before but never CBC. There is a lot of genetic variation in most high CBD hemp strains and I think we can come to expect more non target cannabinoids in hemp extractions.
1 Like
Yeah, the pH of the analytical sample makes a big difference in absorbance, per Hazekamp.
2 Likes
I suspect the absorption data reference made was from this paper. At least this paper explains why the authors cited a difference in absorbance values. They are all so bloody close but THC does stand out from the THCA in that unique way - the absorbance drops off where all the THCA does not if I am reading the HPLC charts right they present of D9 THC vs THCA.
This link lays out how difficult it is to accurately capture a true profile of the compound using equipment likely to be found in testing labs.
1 Like
Here are a couple of (very preliminary) GC/MS plots that get back to the subject of the video from February. We split a load of biomass between two processing labs, one using a spinning band still (don’t know the make), the other using SPD. I ran samples of both distillates on an HP (dated…not Agilent!) 6890/5972 setup, with a Restek Rxi 5-MS 0.18 mm ID x 20 m, 0.18 µ column. While the lower plot shows the oven method could be modified to improve resolution, the take-home message is that for the SPD run there were numerous new compounds formed, some of which matched library spectra for THC, some matching HHC, but all clearly separated from actual d9-THC. I don’t have details on the parameters of the SPD, but I have to suspect that either insufficient vacuum, or elevated temperatures (that go hand-in-hand) may have driven these rearrangements. I’m still optimizing the GC conditions, and will post as the plots improve. If anyone is interested in the mass spectra, I can provide.
Plate (2-plots, same biomass).pdf (187.4 KB)
5 Likes
Yes, that is the paper, alright! Thanks!
VERY interesting! I would be keen on seeing a wiped/rolled film chromatogram in this set, too, if you have access. Being that these two methods (SBD & SPD) are so similar… one uses dynamic band for column “packing” while the other uses either nothing or static packing material in the column, I would bet a significant component of the variation seen here is lab/operator/technique… probably moreso than the difference in equipment, if all aforementioned variables are at work.
Photon and all…
One major difference between the two is usually the depth of vaccum obtained. If the spinning band was a BR, I would be willing to better good money that it is getting a much deeper vaccum than most spd. From what I have seen, there is a hard temperature cut off that causes this thc isomerize syndrome. Temperature is the primary cause, but packing matetial and absorptive media in the boiling flask also can accelerate the process.
Again, this is why I keep saying distillate is an inferior product to well made primary extracts. The spd sample shown in the example above is maybe 50% d9, and 30% a stew of other isomers, while the total cannabinoid content is probably very similar between the two. Hell, even the spinning band sample might have 3 peaks co-eluting in the thc window, I suspect one is d8. There is opportunity for a very good research paper here, maybe even 2 or 3.
The more I talk with people about this syndrome, the more alot of us are starting to think staying away from distillate is wise from a health and economic stand point. You currently can not trust any distillate test reports on the market.
5 Likes