Name: Farid
Company Name: Minuteman Production Insights
Contact Info: (two zero seven) 329-4357
Location: Malden, MA
Team Size: 1
Services Offered: KPI dashboard creation
Rates, if public: $500 - $10k per dashboard (depending on complexity)
States Available in: Any if remote. New England if on site work is required
Insured?: No
OLCC Workers Permit?: No
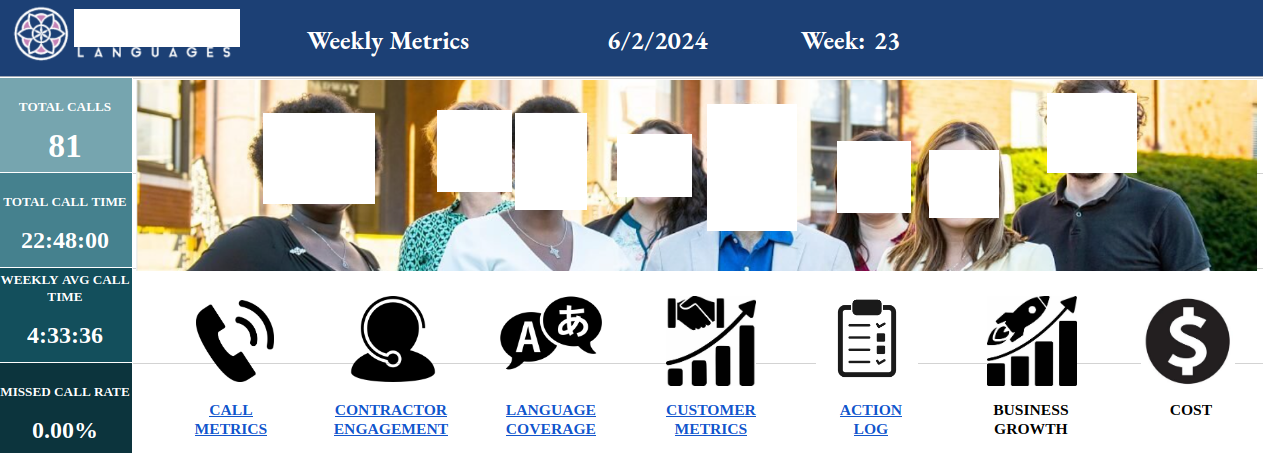
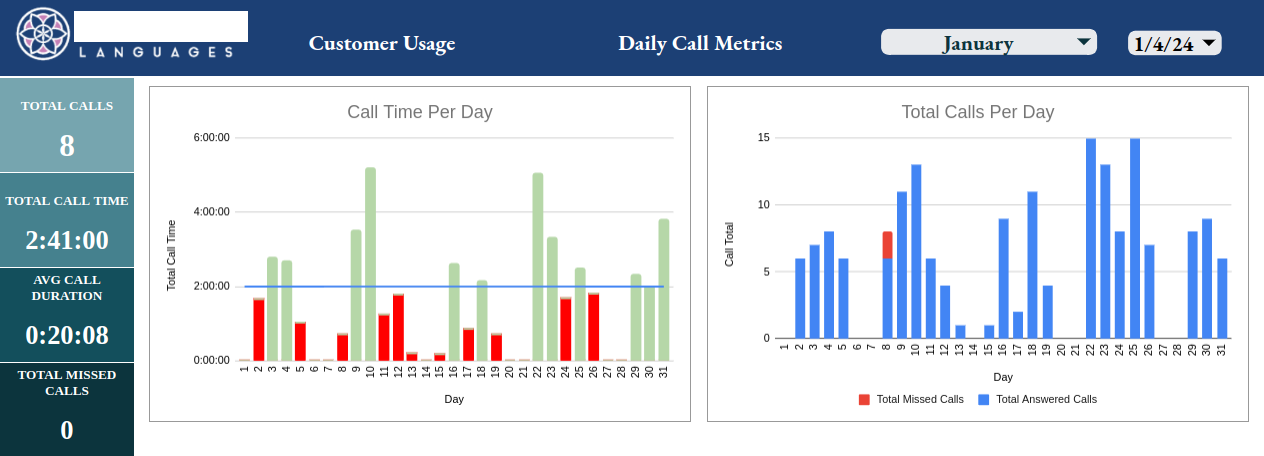
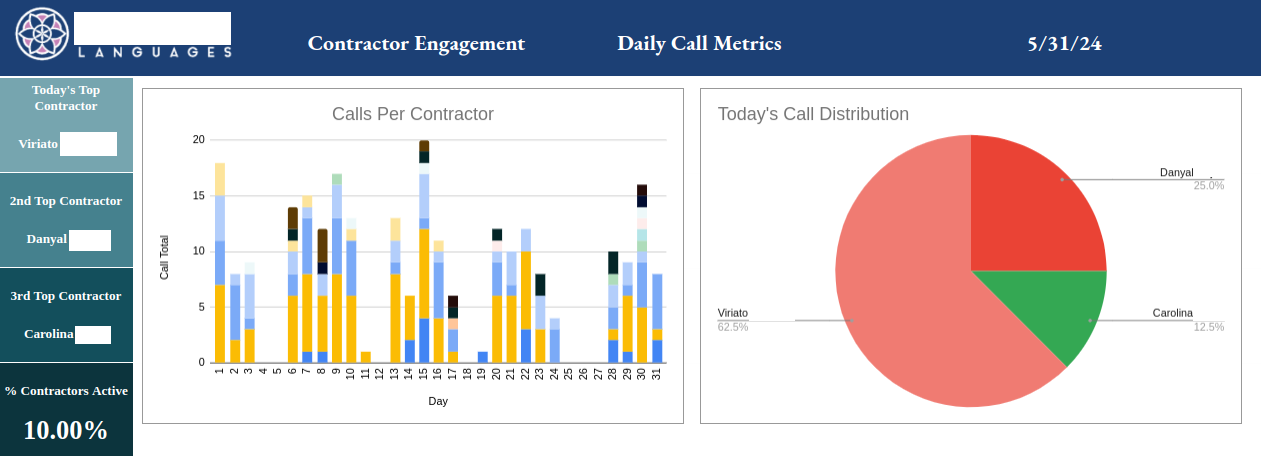
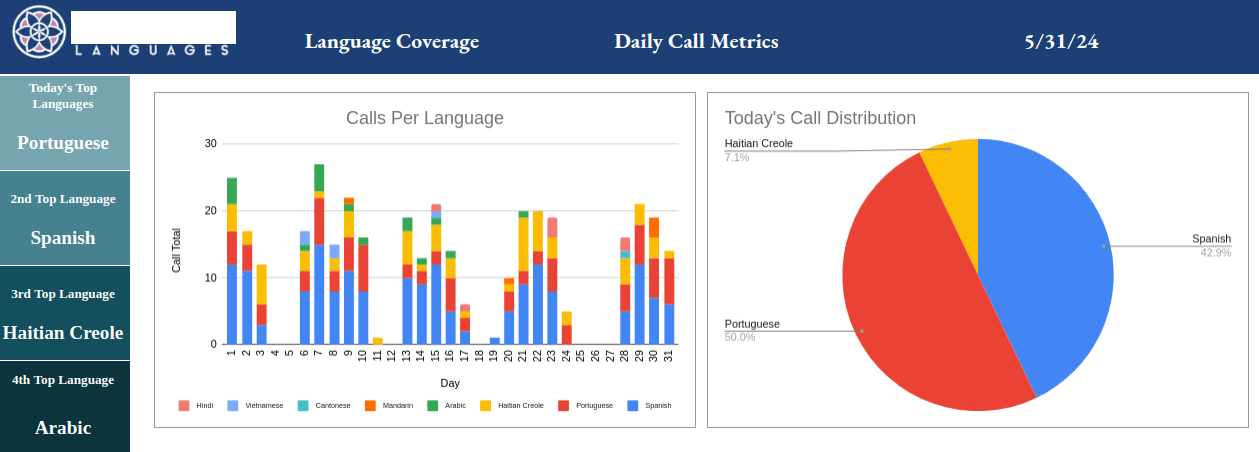
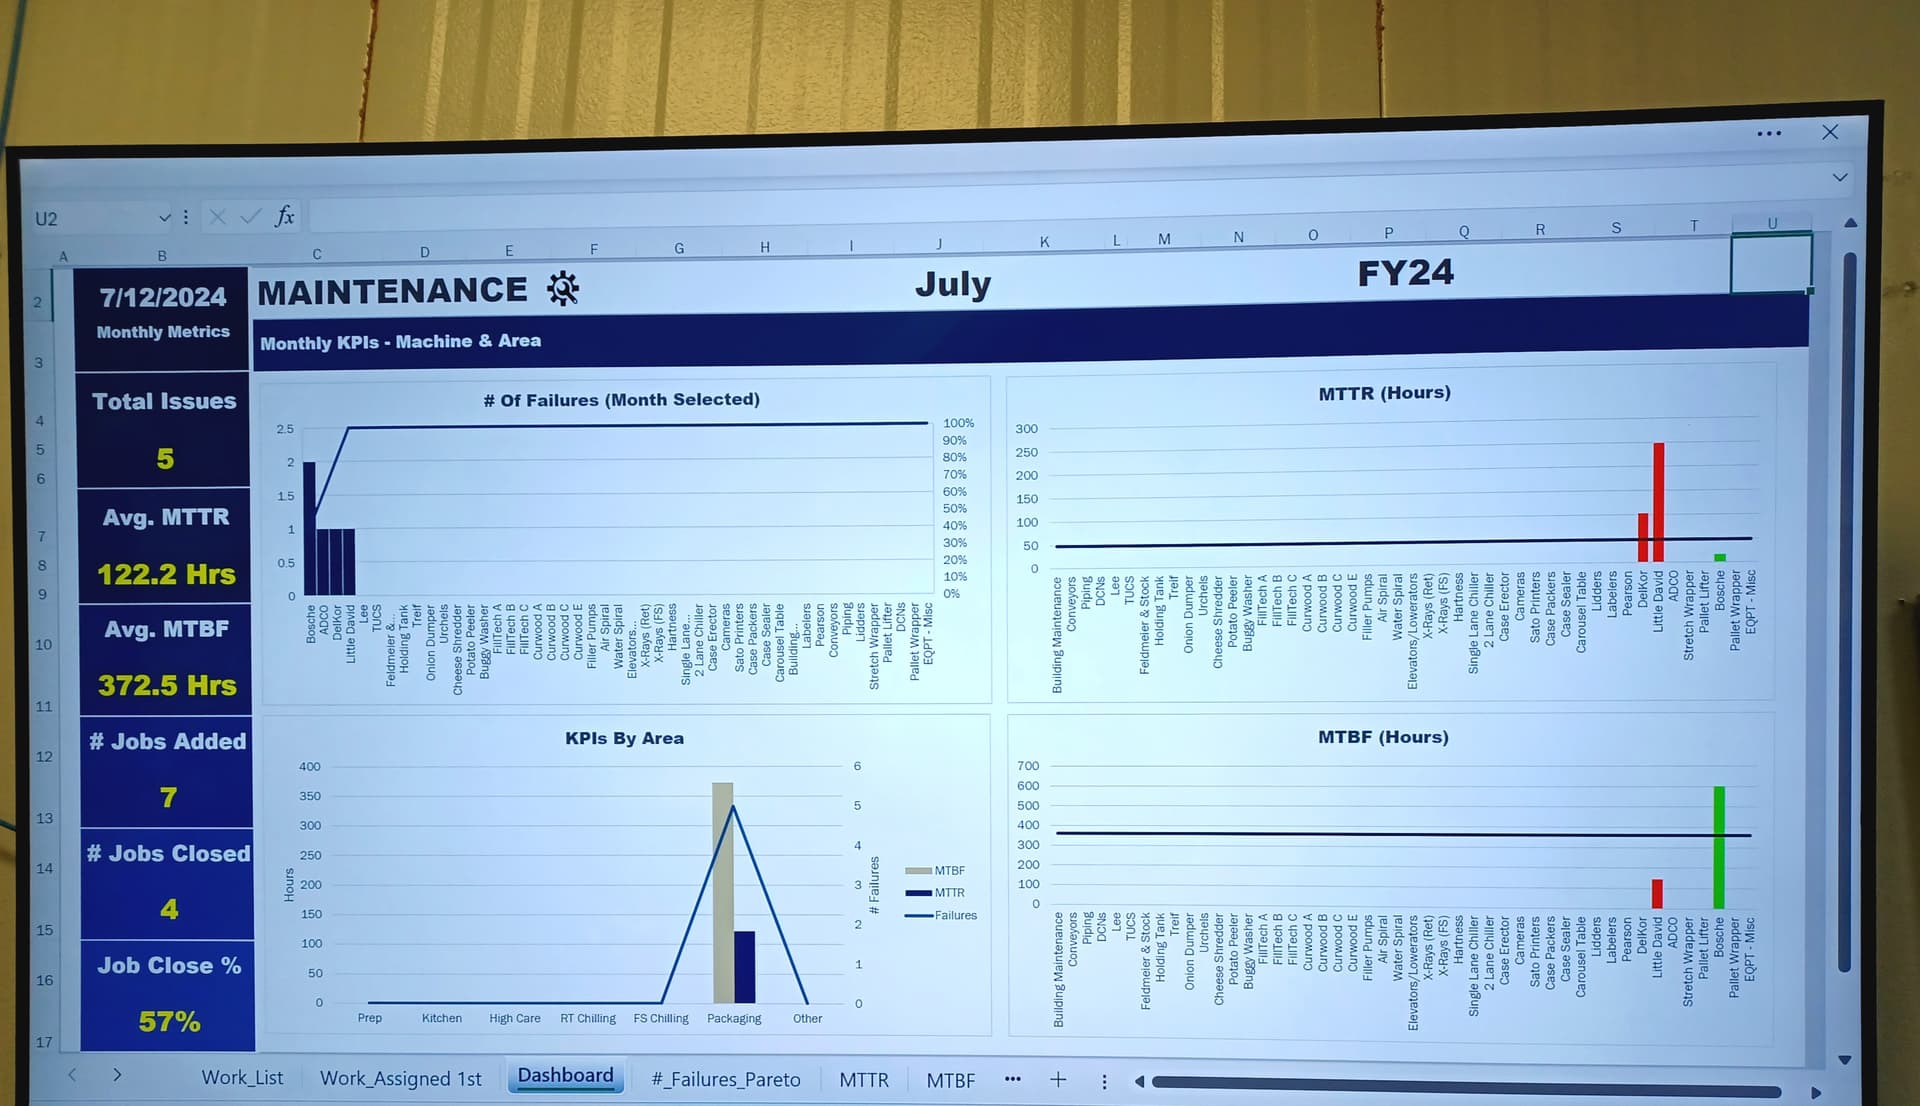
I offer tailor made KPI dashboards for managing on the shift, daily, weekly, monthly, and yearly level. Standard SPQDC daily dashboards are on the less expensive side, and more complex dashboards on the more expensive side (for example tracking things like downtime, OEE, schedule adherence, etc).
These dashboards are made in excel, but are designed to be displayed on TVs, and to be presented during meetings. They are visually appealing - and do not look at all like a normal excel sheet. I leverage AI tools to create highly complex functions and macros to unleash immense capabilies. The dashboards are easy to use and maintain. Best of all there are no yearly subscription costs that come with other data management tools.
To give some background, I work in the food industry, and spent many months designing and refining our plant metrics dashboard. Soon after, I worked alongside a big name consulting group, and I saw what they charge to do the same thing… I was shocked at how low quality it was, and how much we were paying.
That has inspired me to offer this service on the side. I started by making a dashboard for my brother’s buisness for free. He has been extremely satisfied, and encouraged me to offer this service to others.
I would say my target customers are smaller to medium sized companies, who are not ready to invest a lot in canned data management software, but still need insight into how they are performing.
This solution is very quick to implement and costs very little to get started - hence the name ‘Minuteman’.
I offer free consultation calls, where I will share with you examples of my work. If you’d like to move forward, I will work with you to identify the KPIs you’d like to track, how they will be displayed, and provide a quote for the work.