But there are bad actors as well as good ones, according to Greg Magdoff, CEO of San Diego PharmLabs:
“One of my clients told me that ACS Labs had an option in their checkout process that asked clients, “How much THC would you like in your sample?” For an additional fee, they were willing to fudge the numbers. ACS Labs is being audited by an ISO accreditation agency so we’ll see what the results of that audit look like. I’m not surprised that they’re the most common lab used to test these hemp D9 products. They might get their ISO accreditation suspended as a result of the audit.”
funny to see pharmlabs saying this, I guess they’re butthurt all their business left when they started calling out d9
We have all been saying the testing game was pay to play, but they finally caught wind of it. Kinda wild how long they were able to sail along raking it in with no questions asked…
That is interesting indeed. Am I understanding that HPLC does not give good separation of the regular THCs and the iso-thcs? Do you have a chromatogram that you would not mind sharing that you could use to differentiate them for all of us laymen?
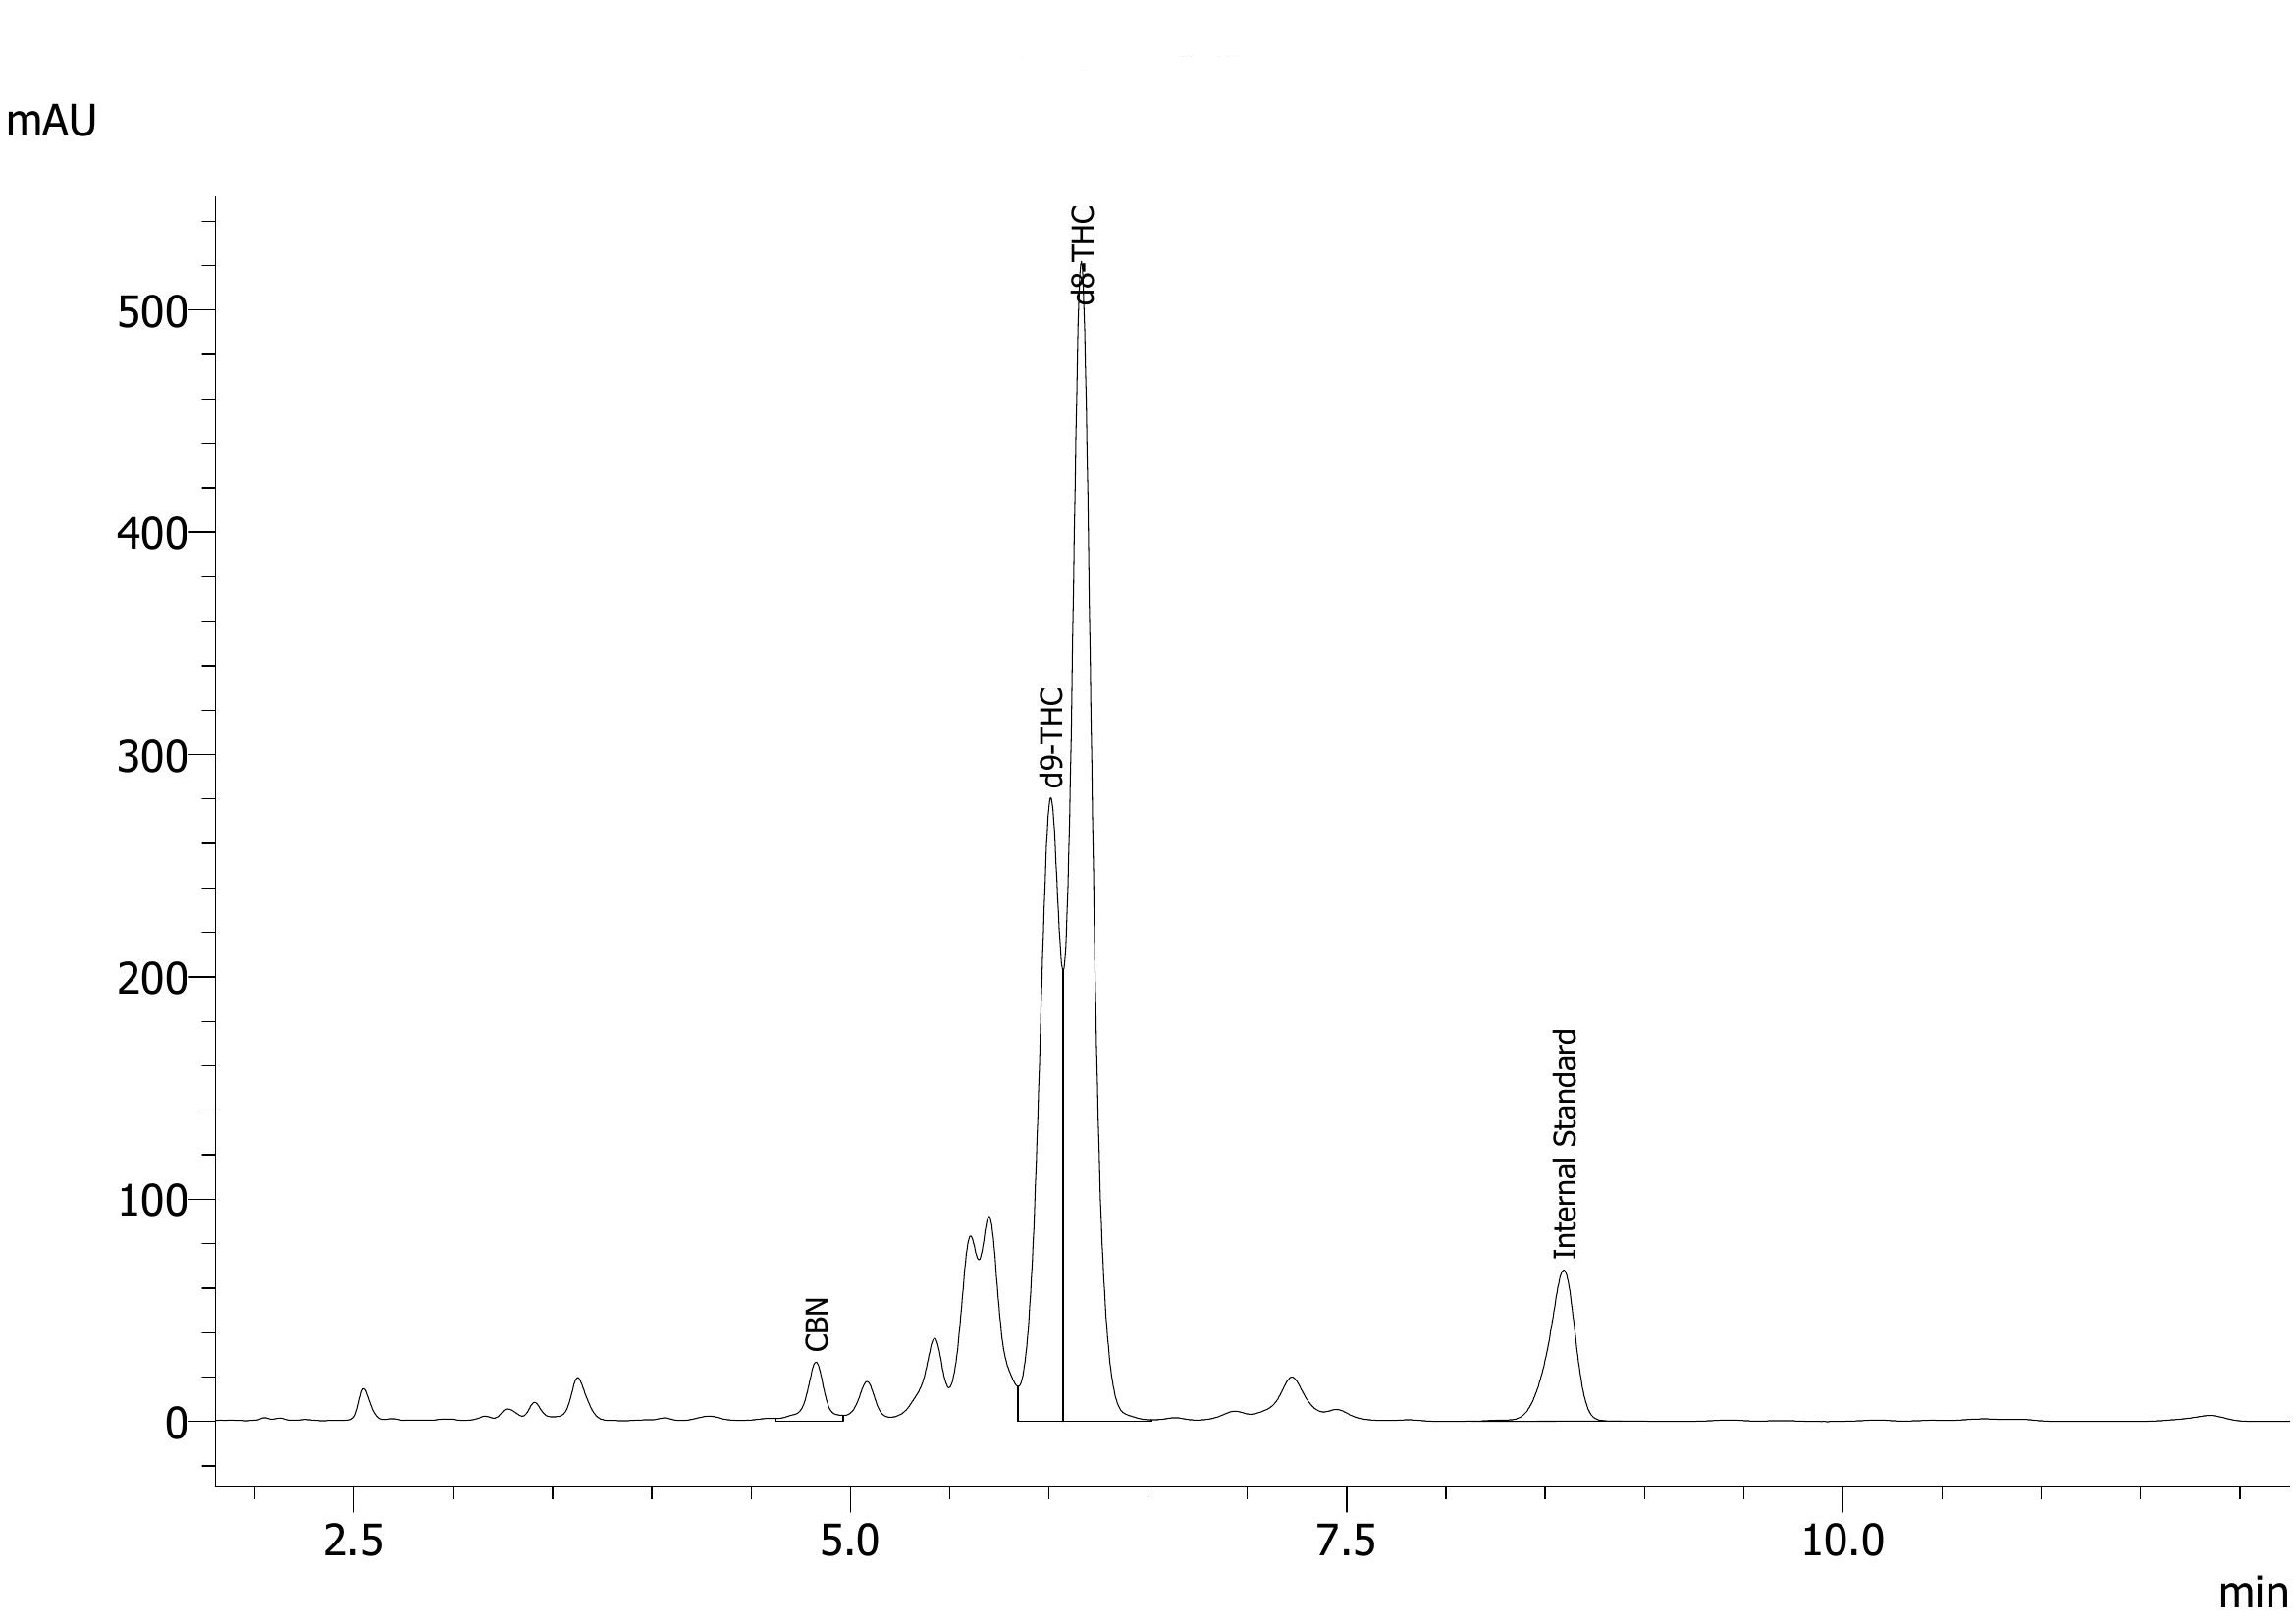
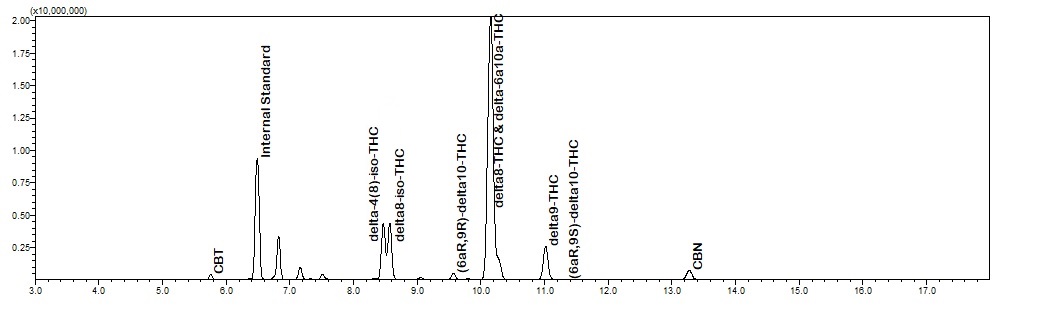
Here you go, HPLC (top) and GCMS (bottom) for the same sample. The iso-THC compounds elute inside the D8-THC and D9-THC peaks on HPLC. CBT is not labeled on the HPLC, but elutes around 12 minutes. HPLC around 7 minutes has the two D10 and two D6a,10a isomers. The mess of peaks to the left of D9-THC and right of CBN is what we’re working on identifying.
I REALLY appreciate you posting that! I too have noticed those peaks on my GC-FID that elute after CBD but before D8. Interestingly enough, I believe that those compounds are produced after the bulk majority of CBD has converted to D8, D9, CBN, etc. I noticed that using our process, ~85% of the CBD converts within an hour, but trying to wring out the last bit by running the RXN longer seems to produce more of those peaks that you believe to be iso-thcs.
So, while I would tend to agree with that statement, I believe it is a bit more nuanced. I have found in our latest runs that ~80% of the cannabinoids have already been reacted before those peaks start climbing. It seemed that as we were running longer and longer to try and force the remaining 20% to react that those peaks started climbing. I have finally modeled the RXN with an excel chart that correlates to the 17 samples that we took over the course of the 7.5hr RXN which was really cool to see the change in noids over time. I still need to go through and save all the chromatograms as images so that I can easily flip through them.
I was mainly dealing with the two main patways producing thcs and iso. But of course there are other reactions occuring. The cleanest conversions I’ve analyzed still got 20+ components (ptsa).
What method and peaks are you dealikg with ?
Depending on conditions, you may expect the reactions producing breakdown terps to go on further longer (not mentioning non the non detectable breakdown products such as tars). The reaction leading to cbt may behave the same. Besides iso-thcs, there is another pair of more minor components which seems the follow the same trend as the main components.
So we have been working on an experimental reaction utilizing acidified (sulfonic) ion exchange resins and have found the reaction to be qualitatively (visually) MUCH cleaner than straight pTSA. Unfortunately, I wasn’t very good at sampling and testing when we were running pTSA so I don’t have as much data as I do now with the beads. I will also post some data here shortly as I would love your input as to what you see in our chromatograms.
Indeed, the sulfonic resins appears to produce a bit less byproducts, especially the colored ones. I wonder if those are actually produced, but also further get (or stay) sorbed on the resins…
Still, all those resins seems to be notably less specific toward d8, and produce notably more iso-thcs. Ptsa can go up to 93%d8+d9 and 3-4,% iso. Resins are rather about 70-84% d8+d9 and 10-20% iso. In fact I also take this specifity aspect into account when dealing with “cleaness” of a reaction.
Yes. PTSA molecules/crystals do not have the same shape as sulfonic resins (porous polymers in fact, on which silfonic acid groups have been grafted), or as other sulfonic acids (eg PSA, or CSA), or acidified clays, or a bunch of other acidic minerals… amongst all of these ptsa clearly stand out in terms of specificity toward d8.
Ptsa is poorly soluble in hydrocarbons. Most that is introduced in those reaction at 1-5%, remains as a solid.
It does not really matter here as my comment applies to the shape of crystals and interface reaction, or even to individual molecules in solution.
Here this aspects does not necessarily condition the polarity, or polarity may not even be the parameter to consider…
Both structures (palygorskite vs smectite) are generally globally negatively charged, sandwich like structures. Main diferences lie in their chemical composition and the shape of the platelets. One forms ribbons like structure resulting in needles or even fibrous like structure. The other is hexagonal and tend to form more sheets like structures. There is a clear contrast in edge: basal surfaces ratios…
Perhaps this may induces differences in the way things happend on their edges, and have some influence (in case where the edge reaction are more important that what happen on the basal surfaces) …