FWIW, sunlight at ~4,500 feet above sea level (Logan, Utah) has 0.1% UV-B and 5.5% UV-A (unweighted). At high mountain elevations (9600 feet), UV-A is ⪅2.2%, and UV-B is ⪅0.1.5% (unweighted).
The problem with assuming outdoor plants are better because of UV is the lack of controls and the scientific method. All research so far, except for a poorly conducted study in 1987, found UV-B does not affect THC.
Besides the THC myth, there’s no other reason to use UV-B for indoor crops (besides seedlings). Any positive effects from UV-B are better attained through other means (regarding the photobiological effects of UVR8 and LOV photoreceptors.). It’s easy to overapply UV-B, which leads to reduced growth and photosynthesis, for example.
UV-A is beneficial for several reasons (i.e., phototropin and cryptochrome responses). However, we get those same benefits from 400-450 nm blue. So in most cases, UV-A isn’t necessary either.
I am not saying what you believe is incorrect, but without the scientific method and controlled experimentation, it’s only a belief.
If you had reduced % red, you could have increased your PPFD, which leads to a significant increase in yield (up to about 1500-1600 PPFD compared to 1200 PPFD). With all other factors optimized and heavy yielding strains, ~80-85 g/SF all day long (85 g/SF = ~3lb/light at 4’ on center over 16 SF).
With really heavy strains, 1500-1600 PPFD, high CO2, crop steering, high air velocity, ~1.0-1.15 leafVPD, rockwool (or hydroponics) for multiple irrigation events per day, and pushing nutrients hard, you could have seen >90 g/SF.
That doesn’t even include biostimulants and cutting-edge technologies to further increase photosynthesis and yield.
Correct assuming that is an average amount of UV. However when you change elevation, humidity, and other environmental factors, you increase the total index.
You can simply observe, test, and correlate genetic superiority to regions with higher than normal UV index. It’s seriously a no brainer. Like is evolution and the data lieing to us? UV region genetic are THE backbone of our current gene pool. It’s the one consistent environmental factor.
Everything we do indoors, we mimic from outdoor. We just increase the inputs that give us the outputs we want, even to unnatural levels. A majority of the things we do to these plants are a defense response. Heavy feed(increased productions), defoliation(internodal growth, budding/propagation) etc. etc. Giving the plant just what it needs to survive… Leaves you with well you know.
There are a lot of studies coming out. However you could always just try using the aforementioned wavelengths for yourself. I have a feeling once anyone uses high intensity UV A/B and FR will never go back.
Also these studies are almost always mediocre. Research scientists are not cannabis growers. They also are typically not a botanist a majority of those studies have a lot of moot data or are not conducted very well.
You can find studies that are explicitly pinning alot of the cryptochrome mechanisms to UVB light specifically.
Obviously the study isnt revolved around cannabis, because mapping cannabis hasn’t been done yet.
However there eis most definitely something to be said about UV and it’s ability to force the expression of desirable traits.
Is it wierd that cry1 and cry2 protiens lack DNA repair?
Why wouldn’t the BLUE LIGHT protiens have dna repair? Why do they bind to damaged cells? What type of blue light damages DNA?
This isn’t perfect just FYI because usually the rating is %luminous wattage rather than umol of flux. Longer wavelength photons carry less energy and therefore 70% red in watts could be closer to 85% red in umol. Just FYI
I’m used to having SPD data in photon flux ((Φq) PF; μmol/s) from an integrating sphere or photon flux density (PFD; μmol/s/m2) from a spectroradiometer. It slipped my mind SPDs are typically derived from absolute radiant flux (Φe) in W/nm or radiant flux density. For example, the SPDs in published studies and academic papers are often in PF of PFD units, not radiant flux. I’m not aware of SPDs derived from luminous flux (Φv) for grow lamps and LEDs (in the last decade).
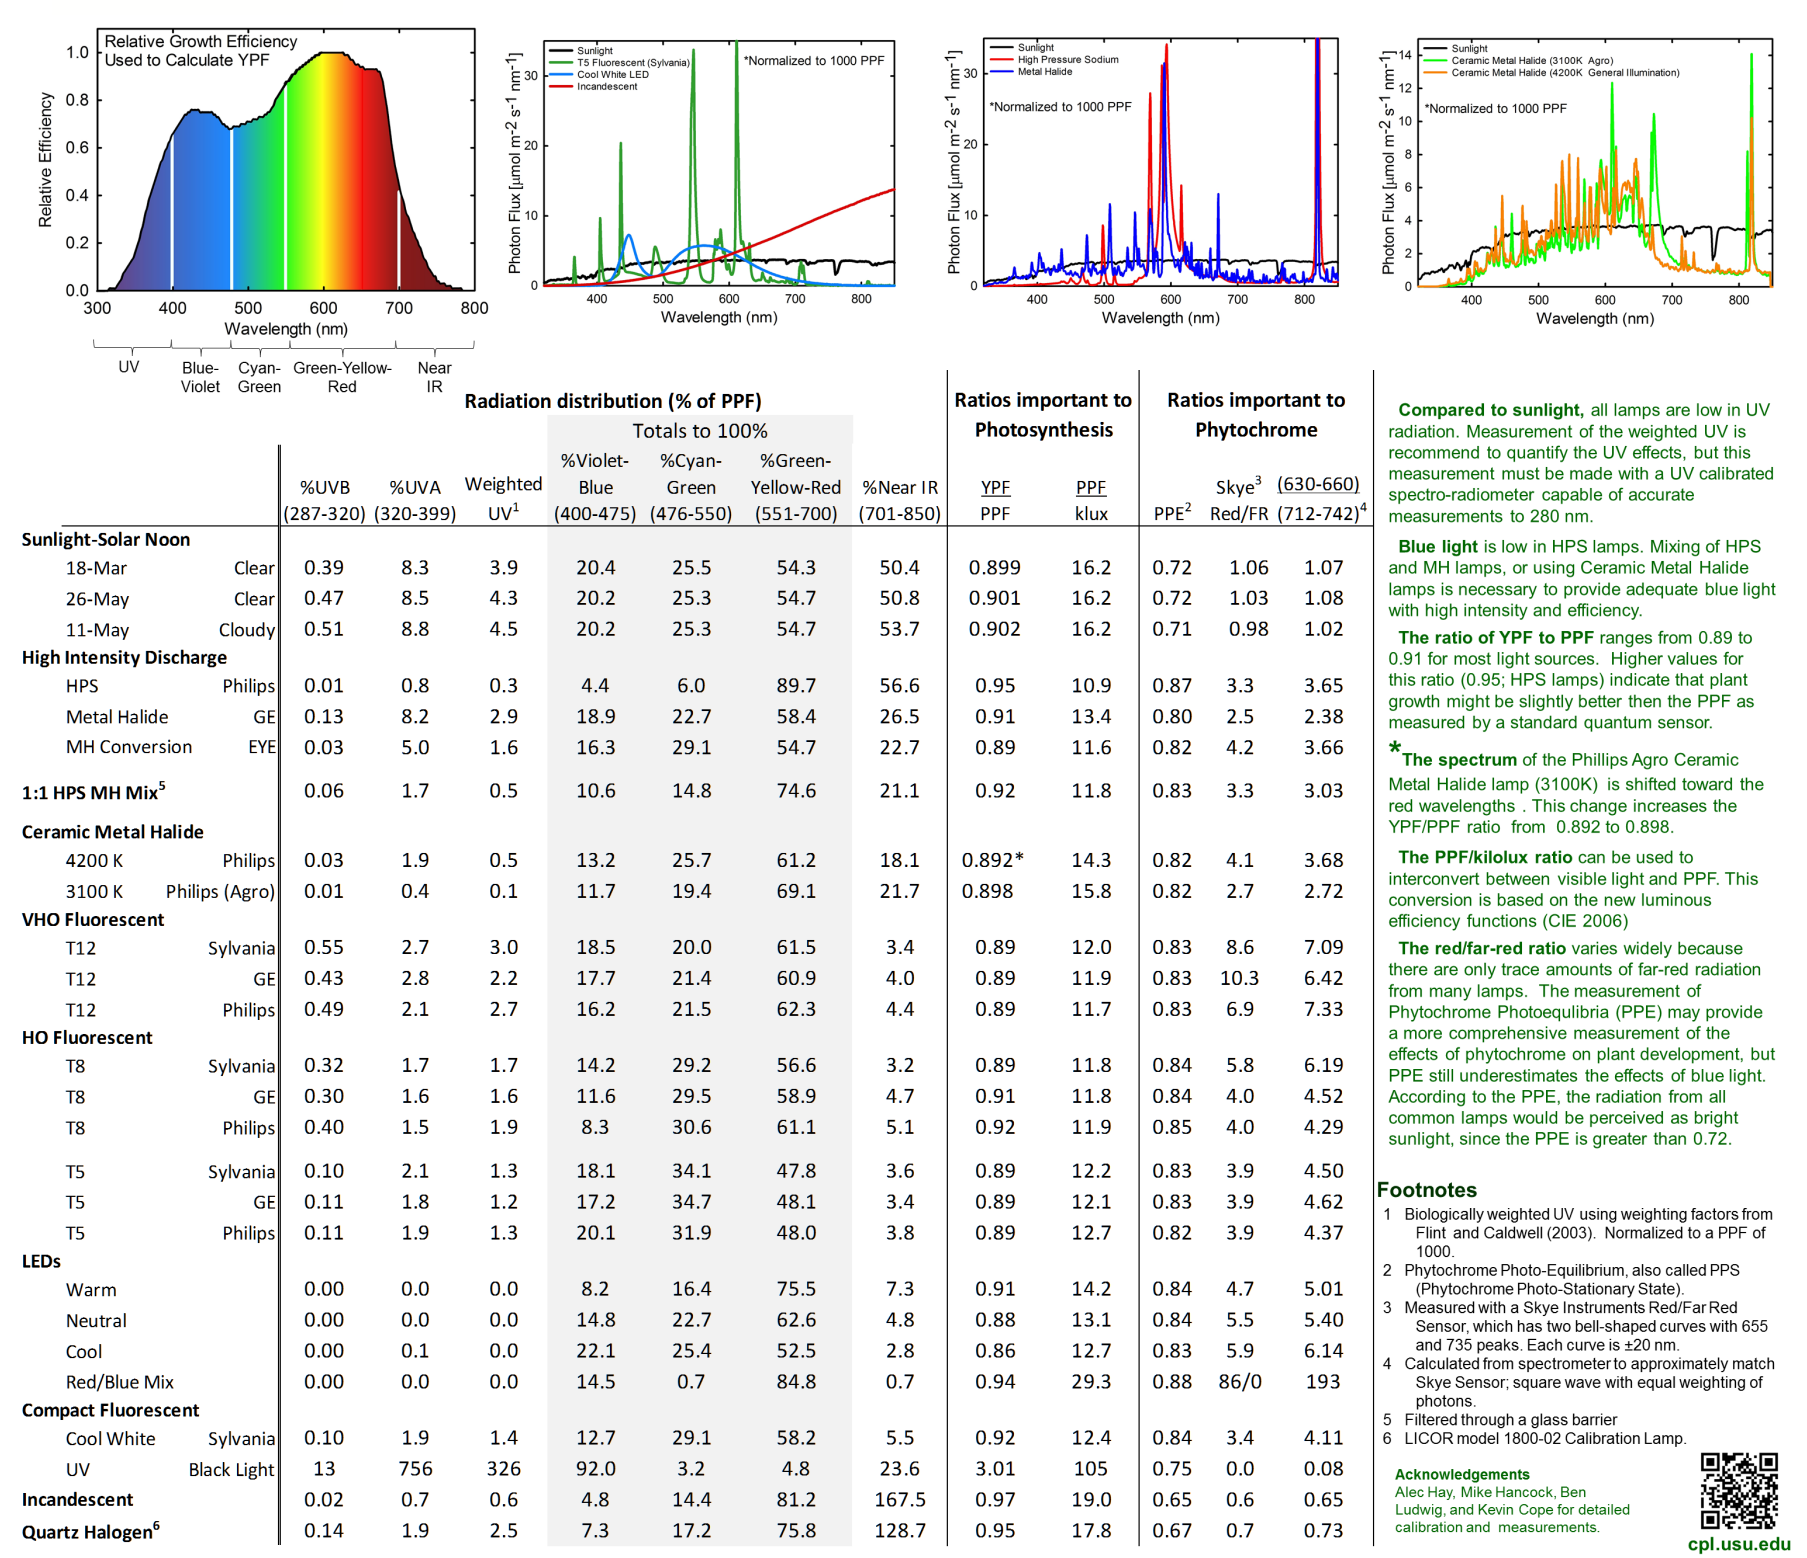
These SPD data are all in photon flux units, not radiant flux:
Note that Dr. Bugbee presents B/G/R as a total of 100% (PPF), while UV and far-red are given as a percent of total PPF:
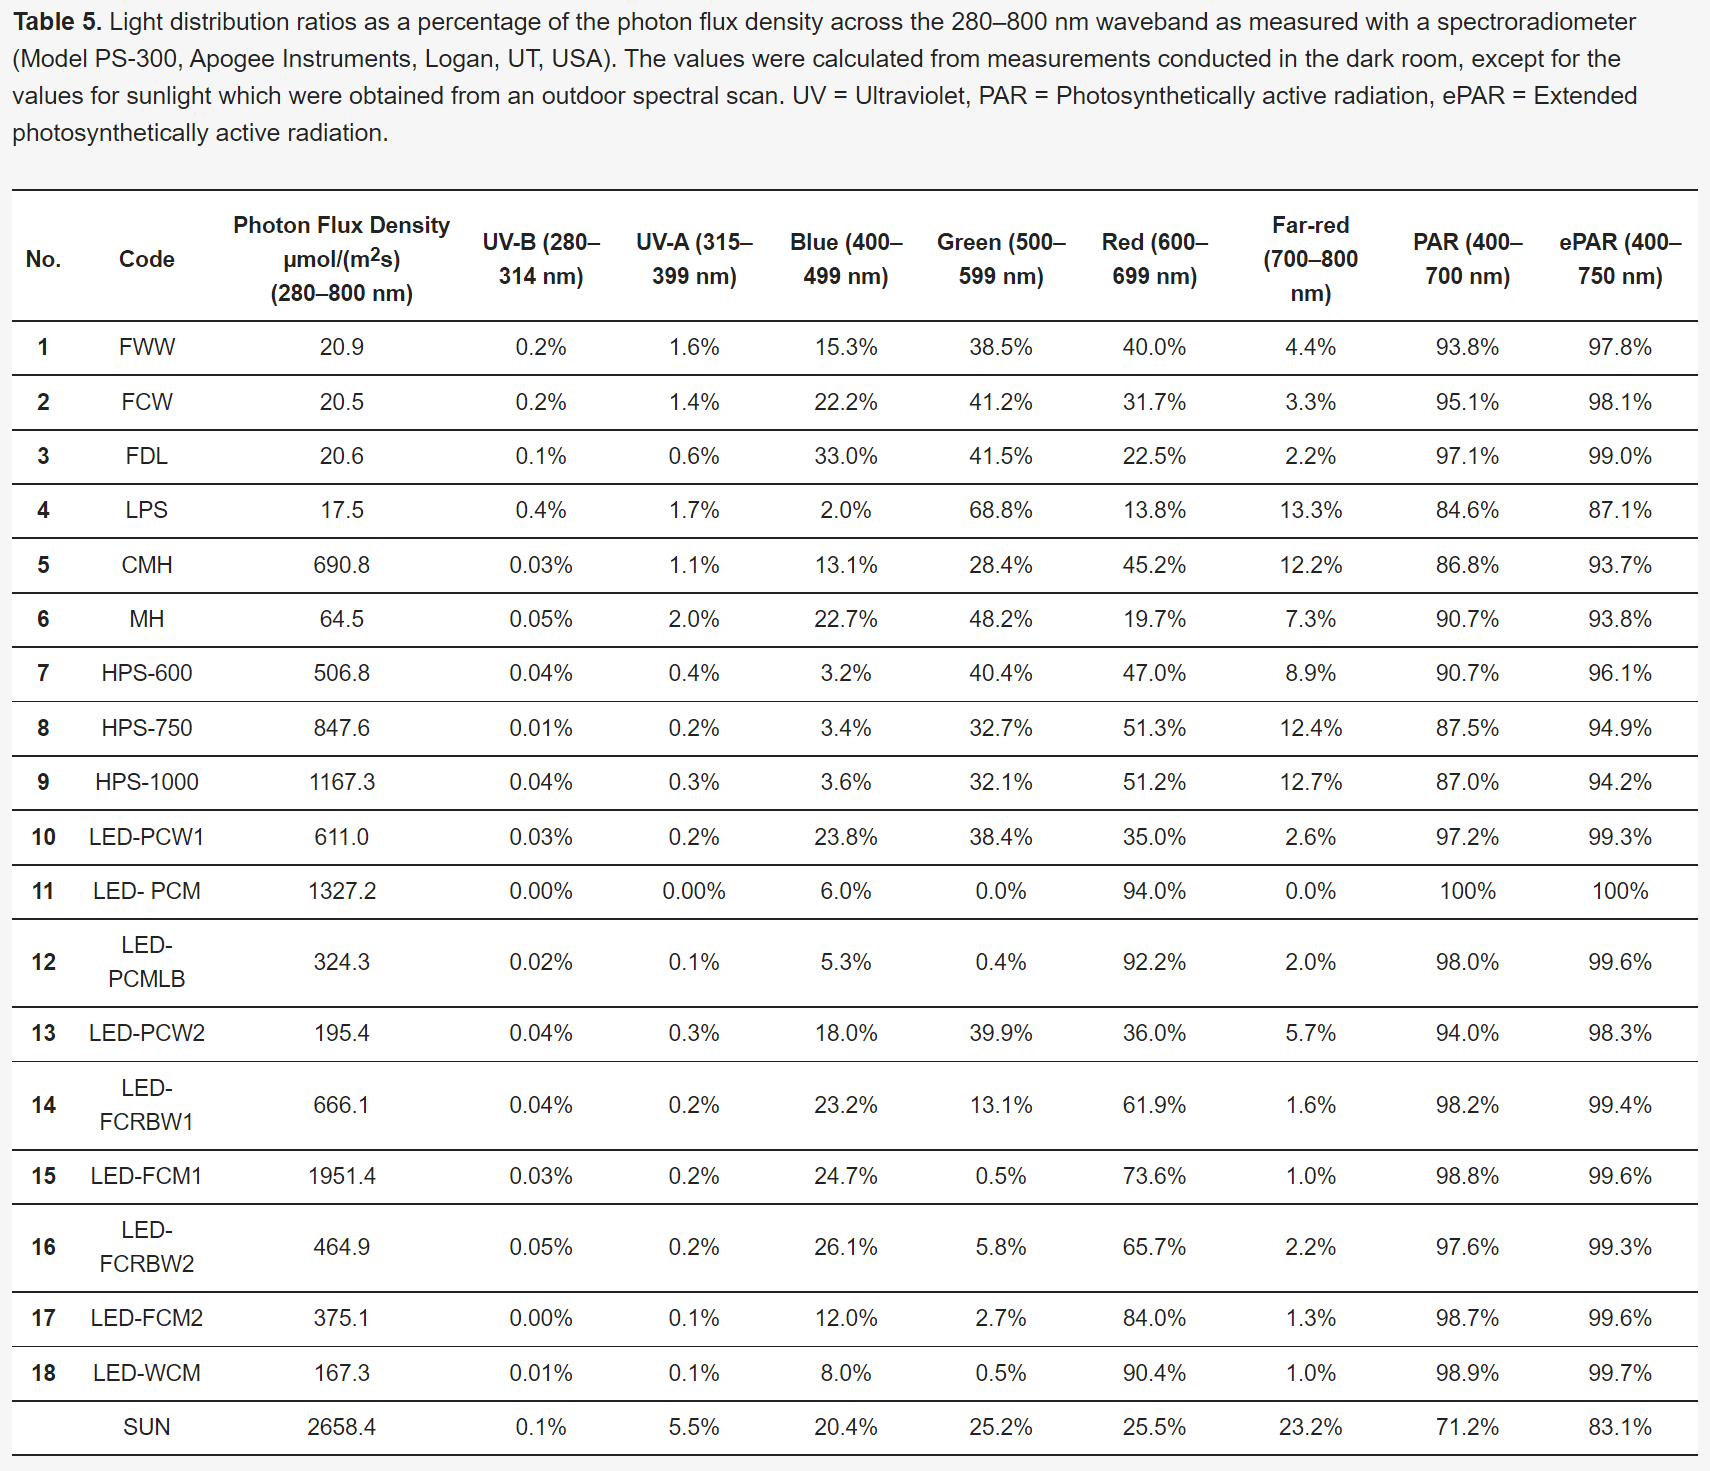
Here are datasets from a 2021 study in photon flux density units. Note that these authors provide the data as a percent of total PFD (280-800 nm). To compare these with Dr. Bugbees, we need to integrate blue through red (as % of PPFD), then find % of B/G/R of % PPFD, followed by finding UV and far-red as % of PPFD:
I plan to create a thread to compare and analyze SPD charts from any lamp or LED when I have a day or two of free time. Including converting SPD ranges (UV/B/G/R/FR) as W/nm to μmol/s.
Basically, an updated and improved version of Knna’s “bulbs comparison tool.” My method includes computer digitization of SPDs, not the hand method as Knna used. Hence, it greatly improves the digitization process’s accuracy, simplicity, and speed. Plus, Knna’s spreadsheet assumed lamp mfgs reported luminous flux. In contrast, today, they report photosynthetic photon flux. I have included updated and improved photobiological characteristics (e.g., far-red fraction and B:G of stomatal conductance action spectra) and technical performance characteristics. Hopefully, this coming weekend, but maybe not that soon.
Anyone can share SPDs in the thread, and I will digitize and analyze it for them.
I will use the SPD ranges in μmol/s to find the max PPFD based on photobleaching threshold of 700 μmol/s/m2 red [700(/% red/100)] for their specific luminaire. And at that point, they can use the simple equation I shared in this thread (PPFD*% red/100) to calculate the red range μmol/s/m2 at any PPFD if they want to use greater than 700 μmol/s/m2 red.
Ideally, we could collect a large dataset of red range μmol/s/m2. Under various environments, PPFD, and strains to develop guidance for growers who want to maximize PPFD without photobleaching.
I appreciate your comments and enjoy discussing these topics with you.
Regarding ambient UV, before you posted this, I clarified the UV values (basing them % 280-800 nm). Previously, I used Dr. Bugbee’s values (based on % of PPF). See the following bullet point.
FWIW, sunlight at ~4,500 feet above sea level (Logan, Utah) has 0.1% UV-B and 5.5% UV-A (unweighted). At high mountain elevations (9600 feet), UV-A is ⪅2.2%, and UV-B is ⪅0.1.5% (unweighted).
The UV index isn’t the same thing as unweighted UV. Or the relative quantum response of UV-Bbe and UV-Abe weighted by the action spectrum for growth responses of plants. The UV index is UV weighted by the erythema action spectrum, based on the susceptibility of caucasian skin to sunburn. It would be best if you didn’t use the UV index as a guide for UV photon flux density for cannabis.
You have a point that most “research scientists are not cannabis growers,” but most growers aren’t scientists. So, growers who claim UV is God’s gift are doing so by belief, not robust experimentation. I would take the data from a published research study over what growers claim every day of the week. Plus, I don’t think it’s accurate to claim “these studies are almost always mediocre” and a “majority of those studies have a lot of moot data.”
I tested UV-B many years ago. But the technology was not suitable for plants (high-power reptile lamps), so the results can’t be trusted. Plus, back then, we didn’t have access to labs to quantify cannabinoids and terpenoids.
I plan to run controlled experiments with UV-B and UV-A once I have a spectroradiometer and the Conviron precision R&D plant growth chambers installed in our facility, the same kind used in plant research.
I would guess that because blue light doesn’t damage DNA, UV-B does. It’s the same reason blue light cryptochromes and red light phytochromes increase UV-B tolerance: UV-B damages cells. So the plants have to protect themselves from UV-B. That should tell you UV-B isn’t such a great thing for plants, especially plants that for generations have been grown indoors (so they aren’t acclimated to UV-B exposure). UV-B will always reduce growth rate and yield unless the photon flux density is so low it has no effects (like from a DE HPS). From the study you linked:
Cryptochrome blue-light and phytochrome red-light signalling are known to induce expression of genes that largely overlap with UVR8-induced genes. These co-induced genes include those associated with UV-B tolerance, such as CHS and FLS ; those encoding phenylpropanoid biosynthetic enzymes, which are important for the synthesis of flavonol glycosides that function as sunscreen metabolites; and PHR1 and UVR3 , which encode photolyases important for DNA damage repair5,17,30. This indicates that, in addition to cry1 negative regulation of UVR8 activity, cry1 as well as phyB may contribute to UV-B tolerance alongside UVR8
Do you have a control to compare those data to? Once I create the SPD comparison and analysis thread, if you provide the SPDs for the UV and FR luminaires and UV and far-red measurements I can tell you the approximate photon flux density you’re providing.
I don’t really have a control to compare to. I work with a lot of growers, and a majority of them still use HID. Which isn’t even worth the comparison. Another issue is I exclusively grow from seed, and rarely grow the same thing twice.
I have made iterations, to my lighting, and I actually started using UV with CFL setups, and a high photon flux environment. Eventually moving to CMH, Kessil H380 and then custom bars. (Working on a fully integrated solution now. With better diode spacing and placement)
I do take a lot of spectral data, with my environmentals, and crop steer with growlink. I appreciate the offer. Pretty much all my experience with UV has been positive. It’s going to be hard to convince myself from paper that all my experience is wrong.
I’m not saying you’re wrong. Nor have you proven you’re correct. However, without controlled experimentation, you cannot say that UV positively affects your garden compared to not using UV.
Without using the scientific method, “confirmation bias” is a significant factor:
Confirmation bias is the tendency to search for, interpret, favor, and recall information in a way that confirms or supports one’s prior beliefs or values. People display this bias when they select information that supports their views, ignoring contrary information, or when they interpret ambiguous evidence as supporting their existing attitudes. The effect is strongest for desired outcomes, for emotionallycharged issues, and for deeply entrenched beliefs. Confirmation bias cannot be eliminated, but it can be managed, for example, by education and training in critical thinking skills.
Another bias that you should consider is “observation bias.” Meaning drawing a conclusion by simply observing the plants without measuring or quantifying effects:
Observer bias is one of the types of detection bias and is defined as any kind of systematic divergence from accurate facts during observation and the recording of data and information in studies.
The definition can be further expanded upon to include the systematic difference between what is observed due to variation in [multiple] observers, and what the true value is. [E.g., two people may not give the same quailty rating to a flower’s visual appear, for example.]
And a third concern specific to botany is the “observer effect.” Whereby touching the plants, moving plants, watering by hand, getting the way of fans (reducing air velocity), etc., affect plant growth and skew the results:
Plants have been widely documented to respond to mechanical stimuli such as wind and touch. Well-known and long-studied examples of these are carnivorous plants (e.g. Darwin, 1893), but nonspecialized plants are also sensitive and responsive to mechanical perturbation. Studies on this phenomenon, called ‘thigmomorphogenesis’ (Jaffe, 1973), have been conducted for several decades, revealing complex signaling and response pathways (Braam, 2005). Common thigmomorphogenetic responses include altered shoot elongation vs radial expansion ratios, delayed flowering, changes in chlorophyll content, etc. (see Biddington, 1986 and Cahill et al., 2002 for a review and a concise overview, respectively). In nature, such changes usually occur in response to wind and as a result of contact with neighbouring plants. Humans can unwillingly mimic these effects when studying plants, as several studies have shown that the mere act of touching plants by hand can have significant effects (Braam & Davis, 1990; Cahill et al., 2001). Moreover, in a considerable number of plant studies, measurements are not limited to touching plant tissue but include destructive sampling of leaves, roots, etc. It is apparent that if such (repeated) plant measurements, whether destructive or nondestructive, affect plant functioning, this could have far-reaching implications. Nevertheless, the attention given to such ‘observer effects’ in plant science has been limited.
Implications
If studying plants indeed implies involuntarily altering their morphology and/or physiology, then two main problems could arise. First, in studies on the state of nature (e.g. ozone damage in European forests, Ferretti et al., 2007), the presence of an observer effect could cause such assessments to deviate from reality, leading to erroneous conclusions. Second, in studies with an experimental treatment, a further problem arises if handling plants results in different effects in the different treatments (as already suggested by Cahill et al., 2001). Such a treatment × handling interaction would again distort the study’s results and conclusions, as it implies inflation or understatement of the treatment effects. As treatment studies are often future oriented (e.g. investigating the effects of elevated CO2 concentrations or increased temperatures), this could subsequently lead to an incorrect impact assessment of several global changes.
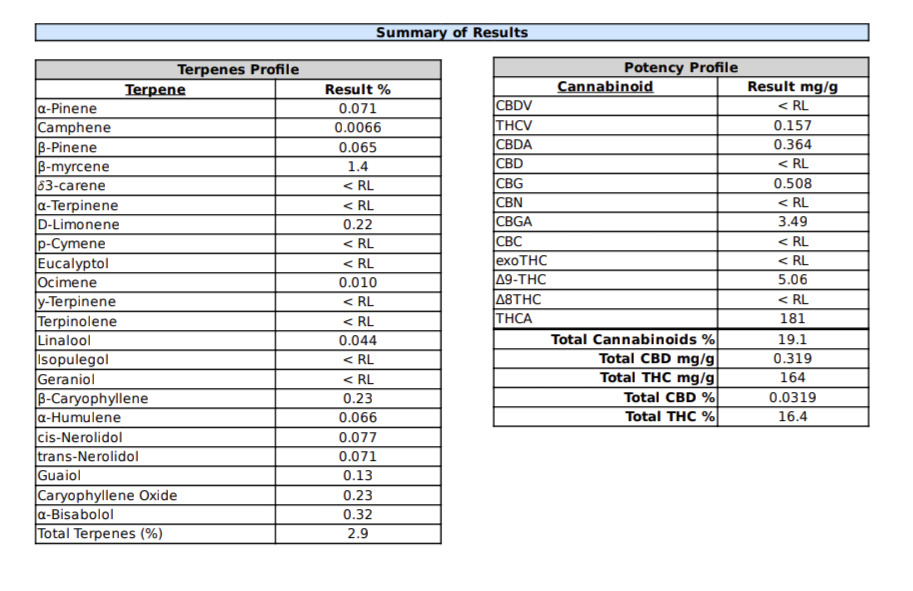
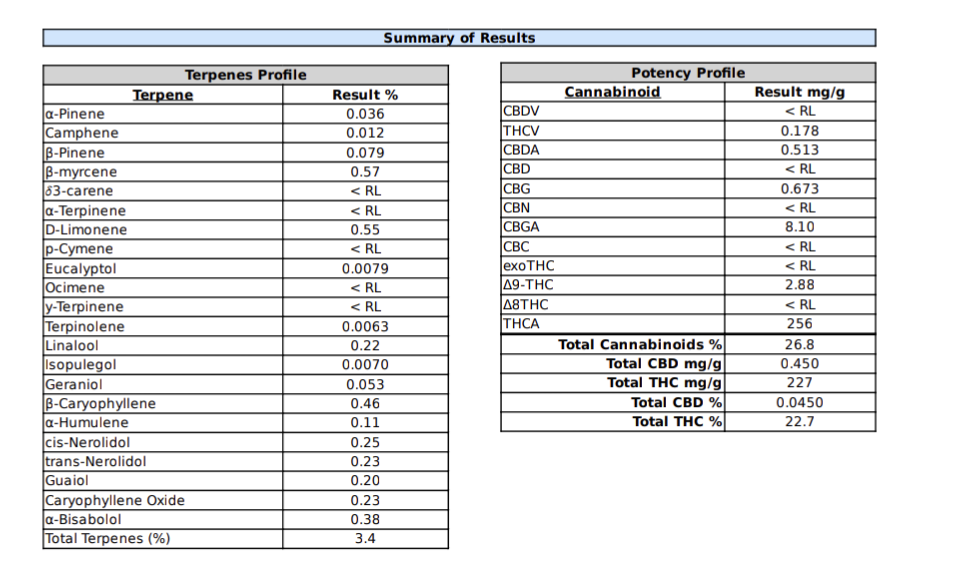
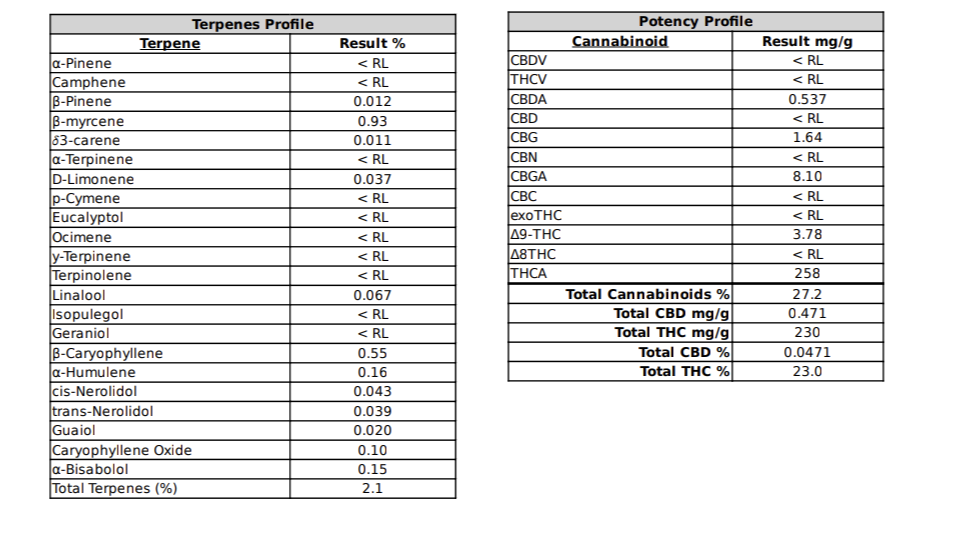
I quantify the results over a large subsets of quality analytical data points. I don’t have the funding or time for a large controlled academic study. I’m also not going to share all the good stuff.
So I’ll just Hollar like a mad man till then. And grow straight mids.
A thought just occurred to me:
Would plants’ defenses against UV-B damage inhibit photobleaching from red photons? E.g., would plants show less photobleaching or withstand higher red PFD before photobleaching occurs.
It’s not a hypothesis, but I will research the possibility. If research buoys my qustion, I’ll form a hypothesis and test it once I have the R&D plant growth chambers.