Pigment Tracker

Hello Future4200,

As some of you have seen, @pdxcanna and I have been plugging a tool we created called the Pigment Tracker. This thread is intended to be dedicated to the Pigment Tracker, the underlying spectrophotometry technology, and the application to Cannabis. I hope you enjoy and look forward to community discussions.

What is the Pigment Tracker?

The Pigment Tracker is a fluorescence spectrophotometer.

Within the Pigment Tracker are three major components. The first component (1) is an excitation light source which can illuminate samples; the second (2) is a light detector which can detect the wavelength(s) and amplitude of a Uv-Vis light source; and the third (3) is a square glass or quartz cuvette with a dilute sample. A windows PC is needed to use the free software.

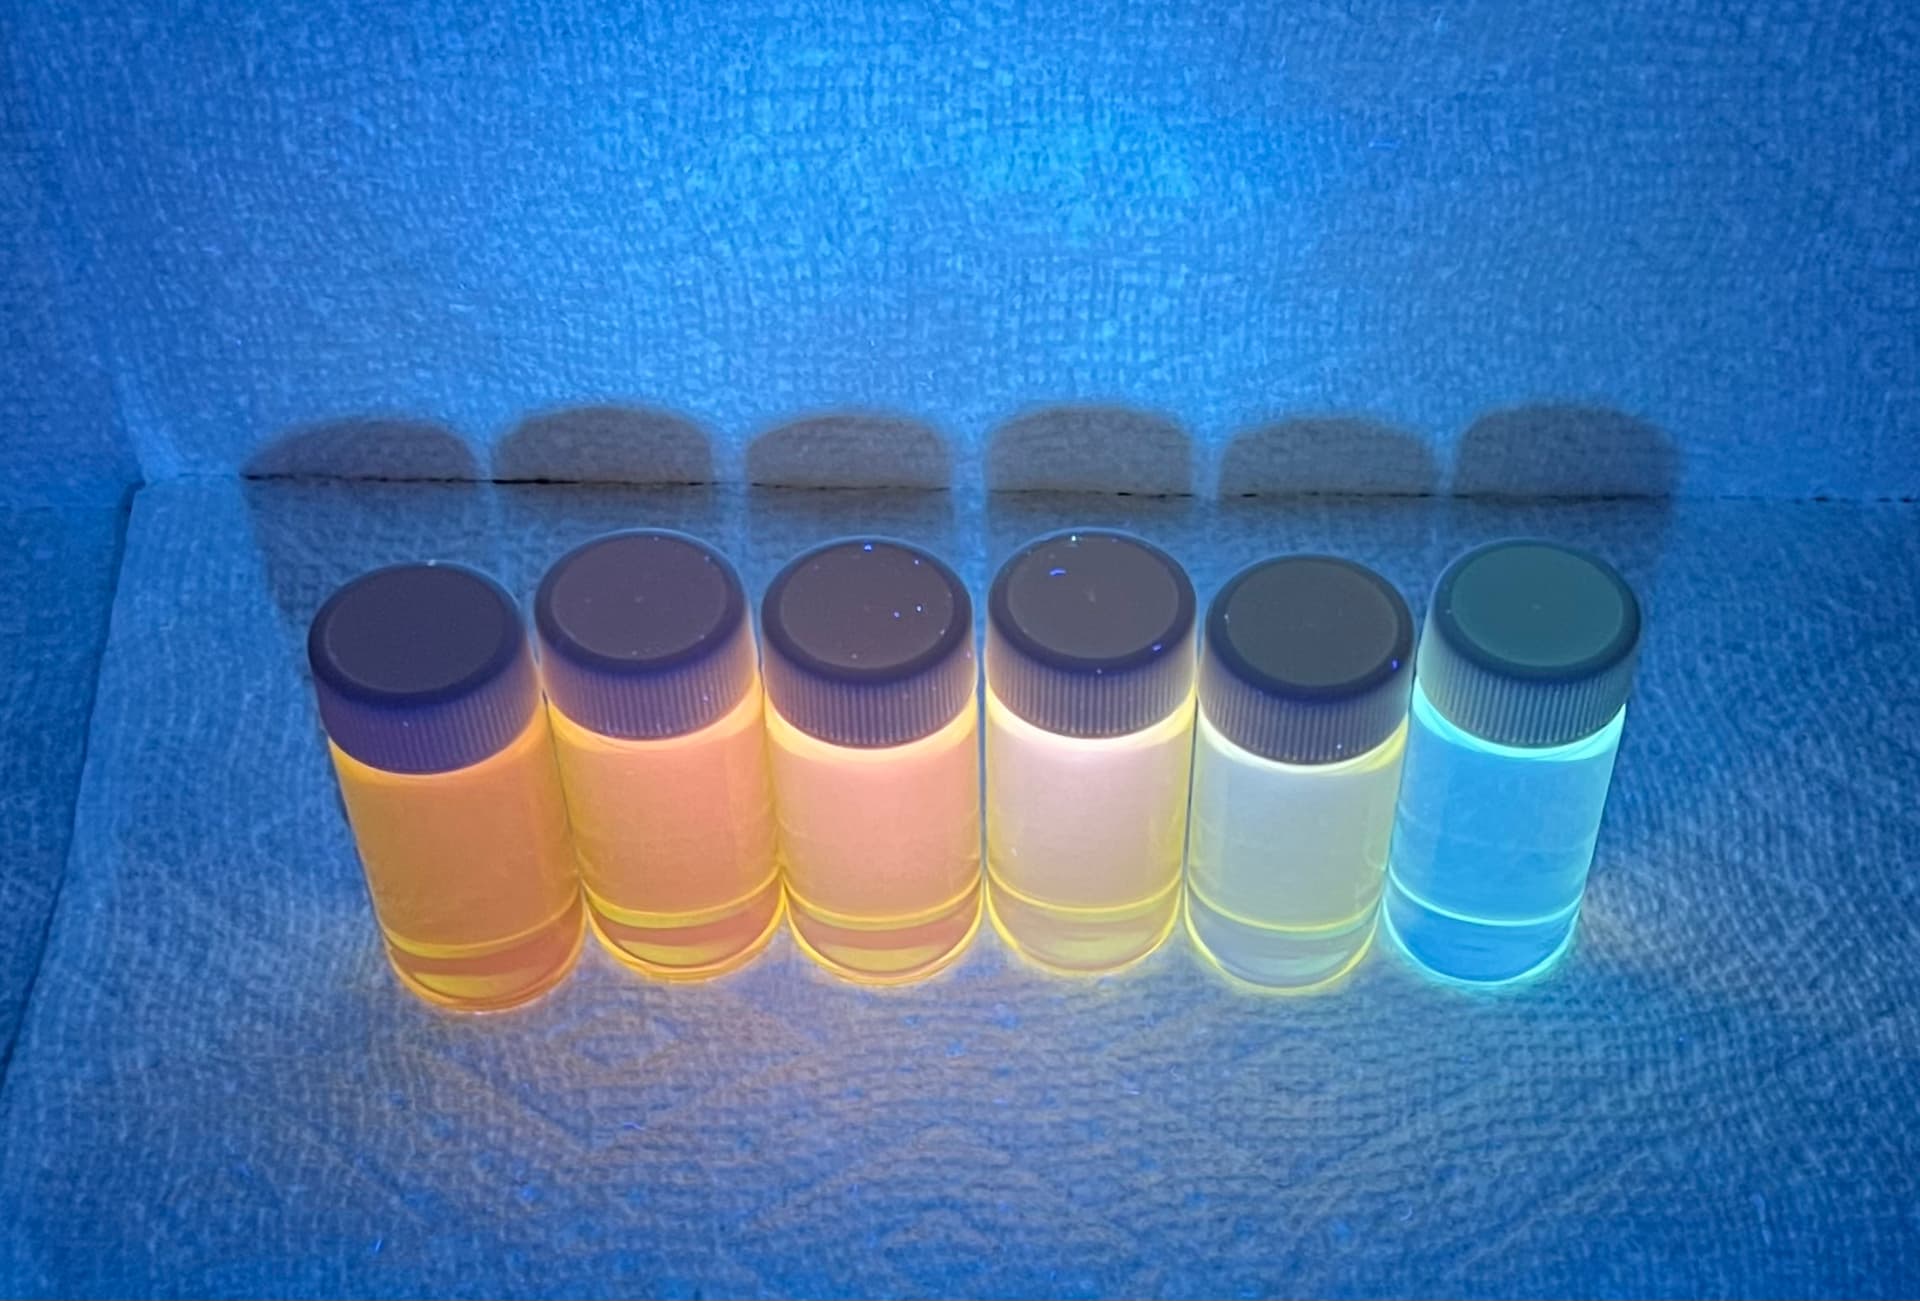
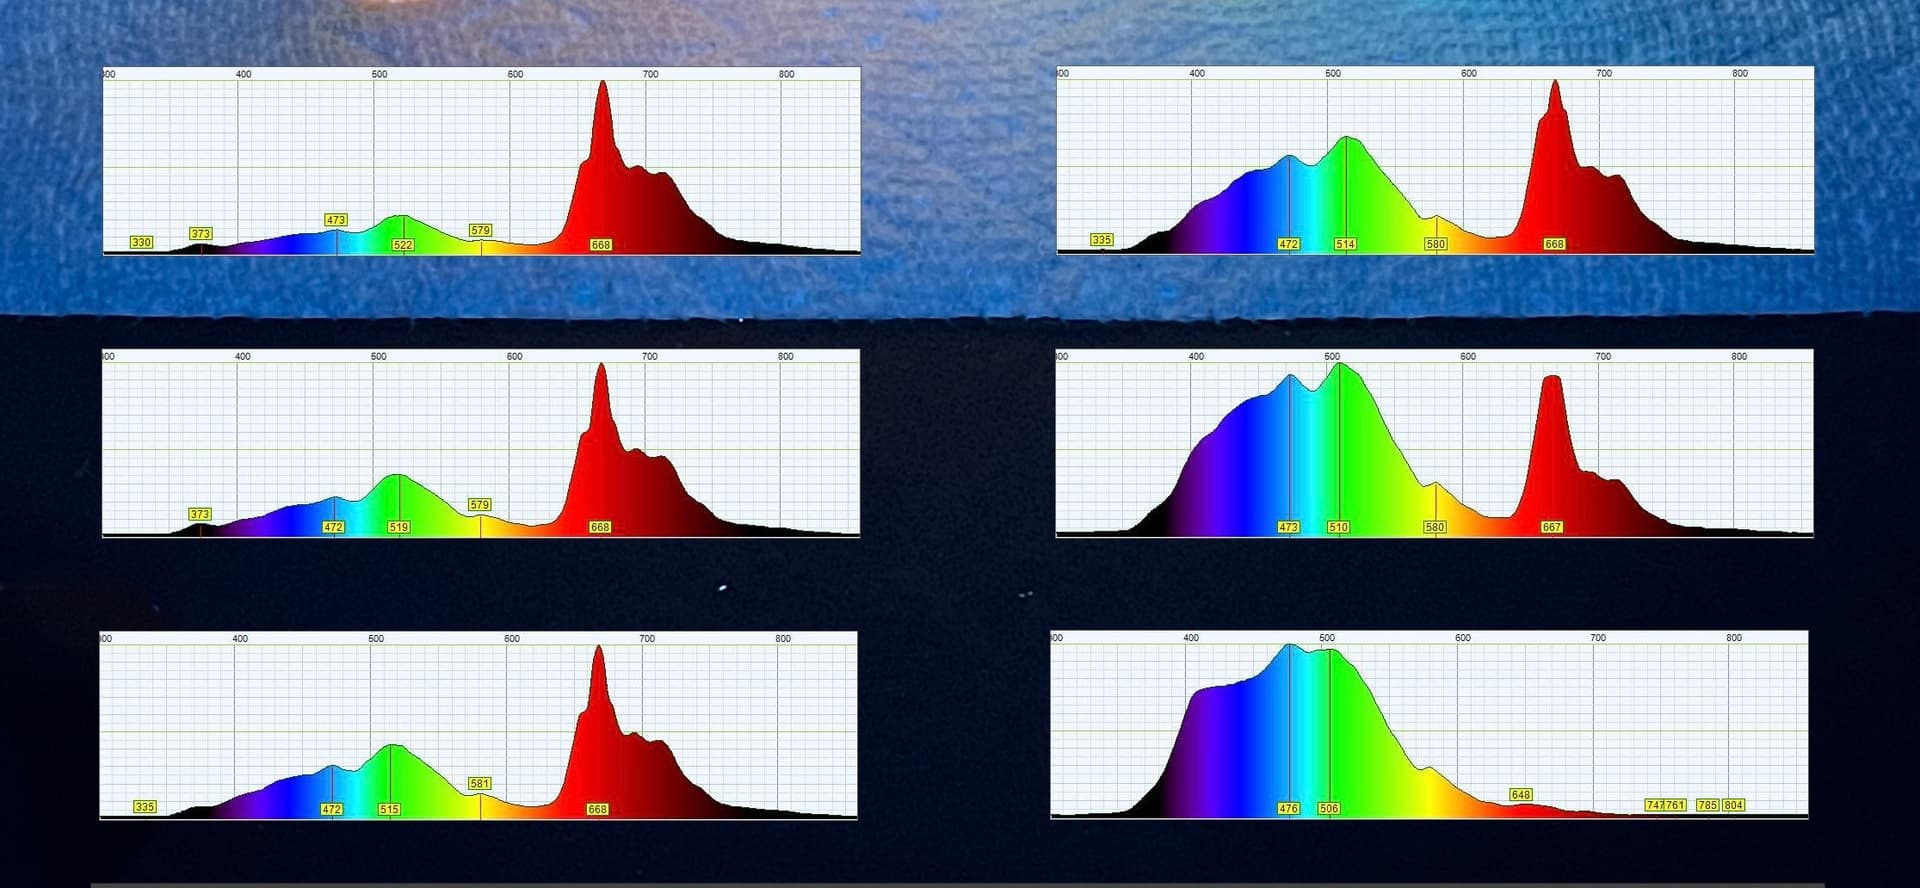
When the excitation light mixes with a sample in the cuvette, fluorescent light may be produced if there are fluorescent compounds present. The light that is produced mixes with remaining excitation light and enters the light detector. That light detector may communicate with a computer to produce a 2D “spectrum” which expresses the wavelength and amplitude of the fluorescent and excitation light.

How does the Pigment Tracker “track pigment”?

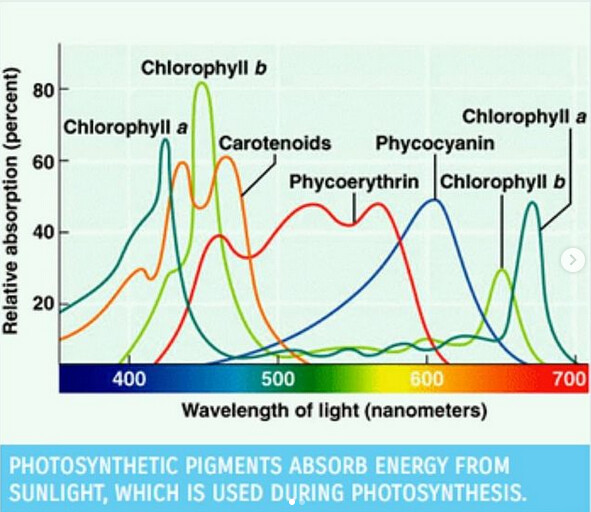
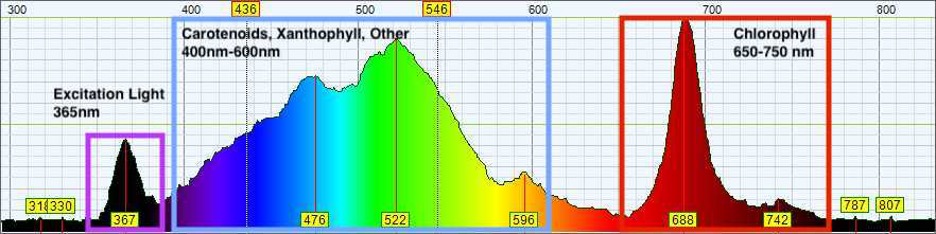
Pigment molecules are used in nature to absorb sunlight of different wavelengths and transfer the energy into plant photosystems for use in photosynthesis. Plant pigments we believe to be relevant include some water-soluble molecules but mostly fat-soluble carotenoids, xanthophylls, and chlorophyll. When these pigments are removed from the plant, they maintain their ability to absorb high energy light. However, instead of releasing the energy to a photosystem, the molecules release the energy as a lower energy photon. These photons are then collected and interpreted by the Pigment Tracker.

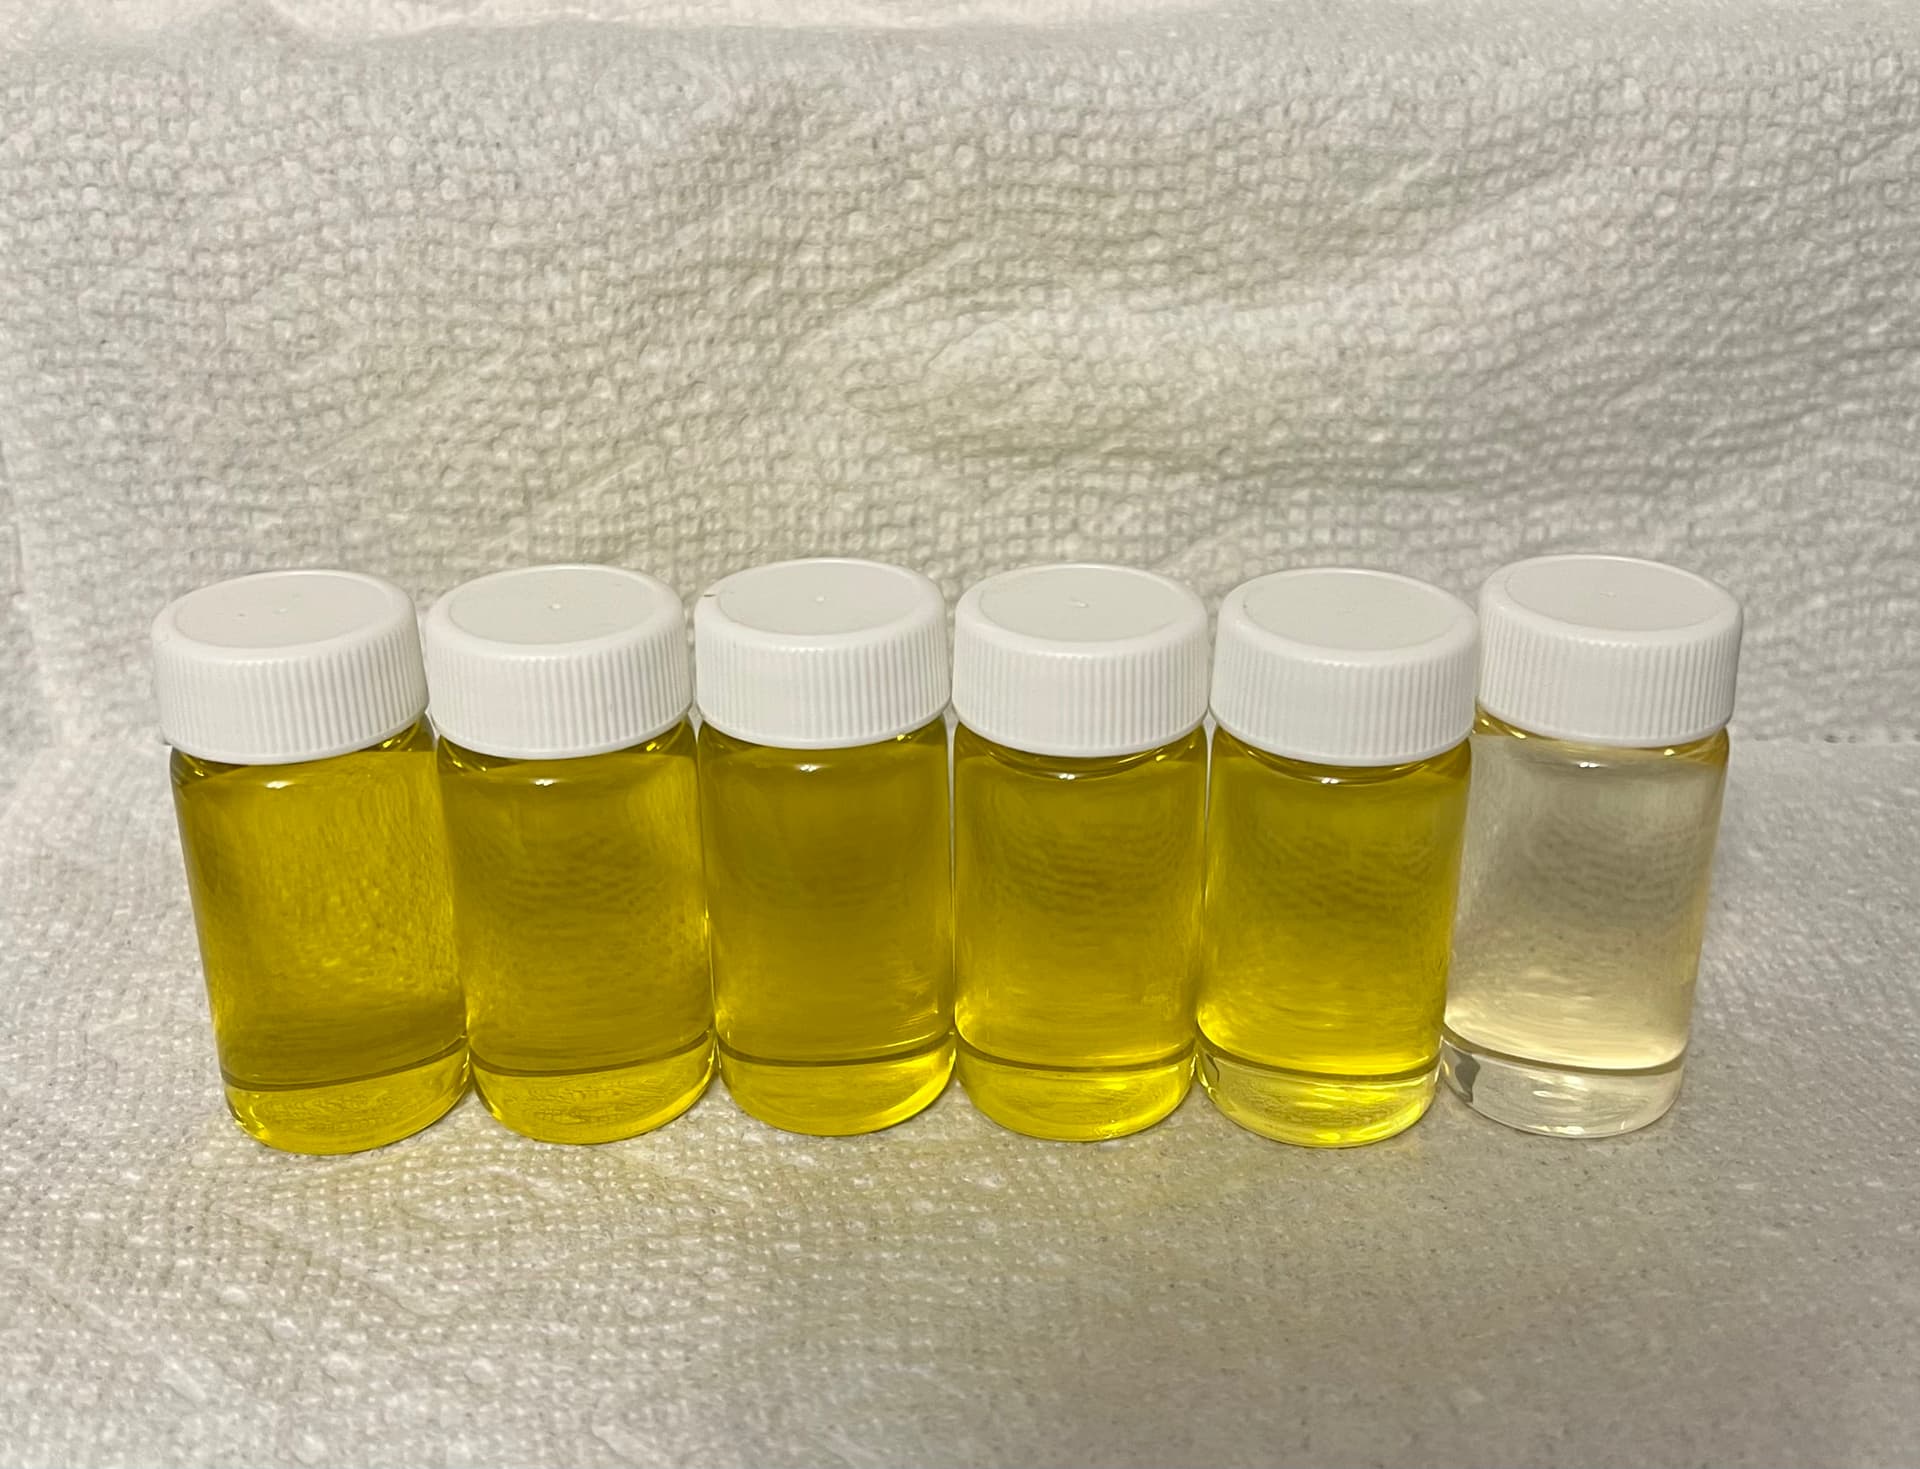
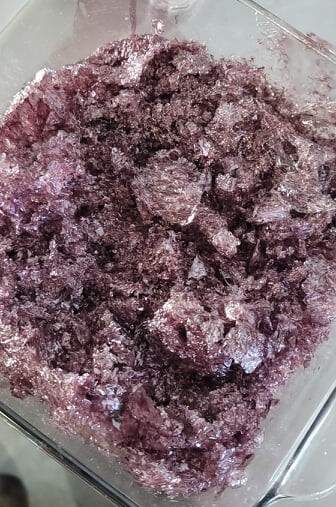
This is a guideline to what the pigments look like when using the Pigment Tracker in a plant oil extraction situation.

Shown below, different quality oils can be tested to observe the specific source of pigment contamination.


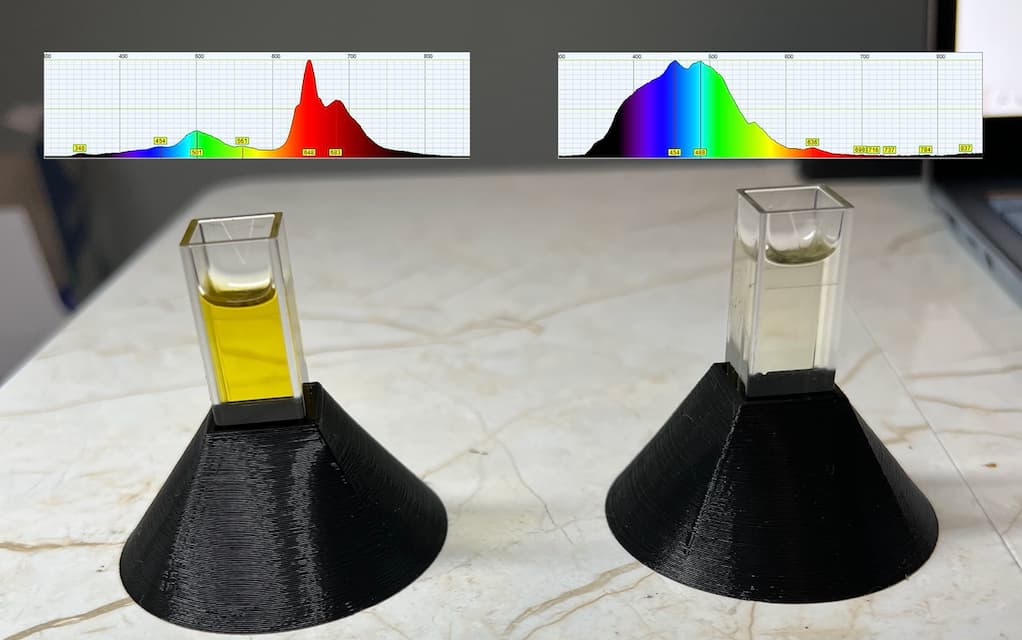
This displays a mixture of pigments including chlorophyll on the left and displays a small amount of carotenoids suspended in very clear oil on the right. By saving the 2D spectrum we can collect and save data which was previously entirely qualitative.

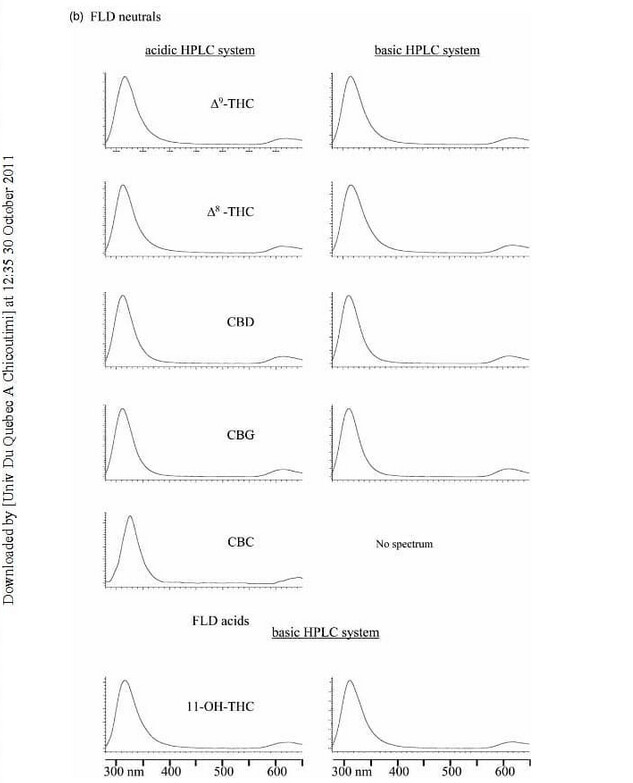
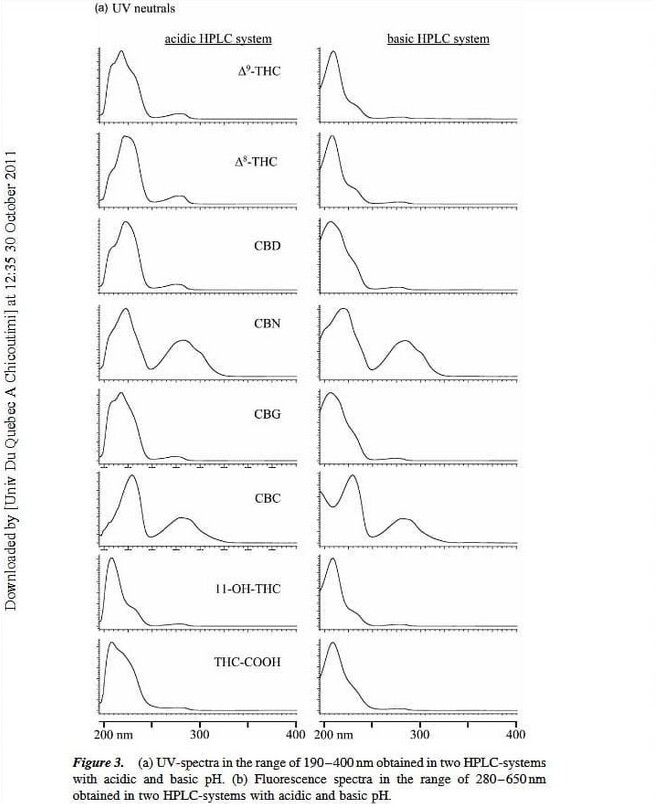
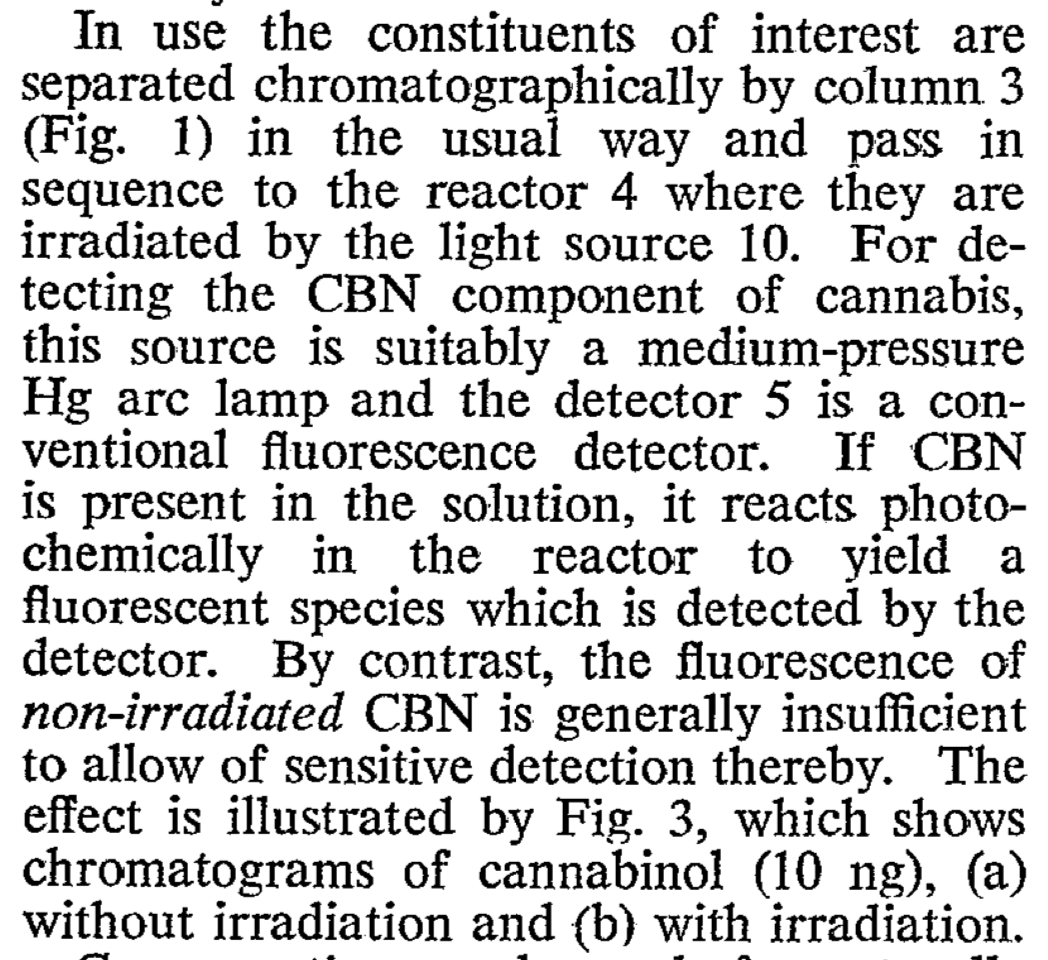
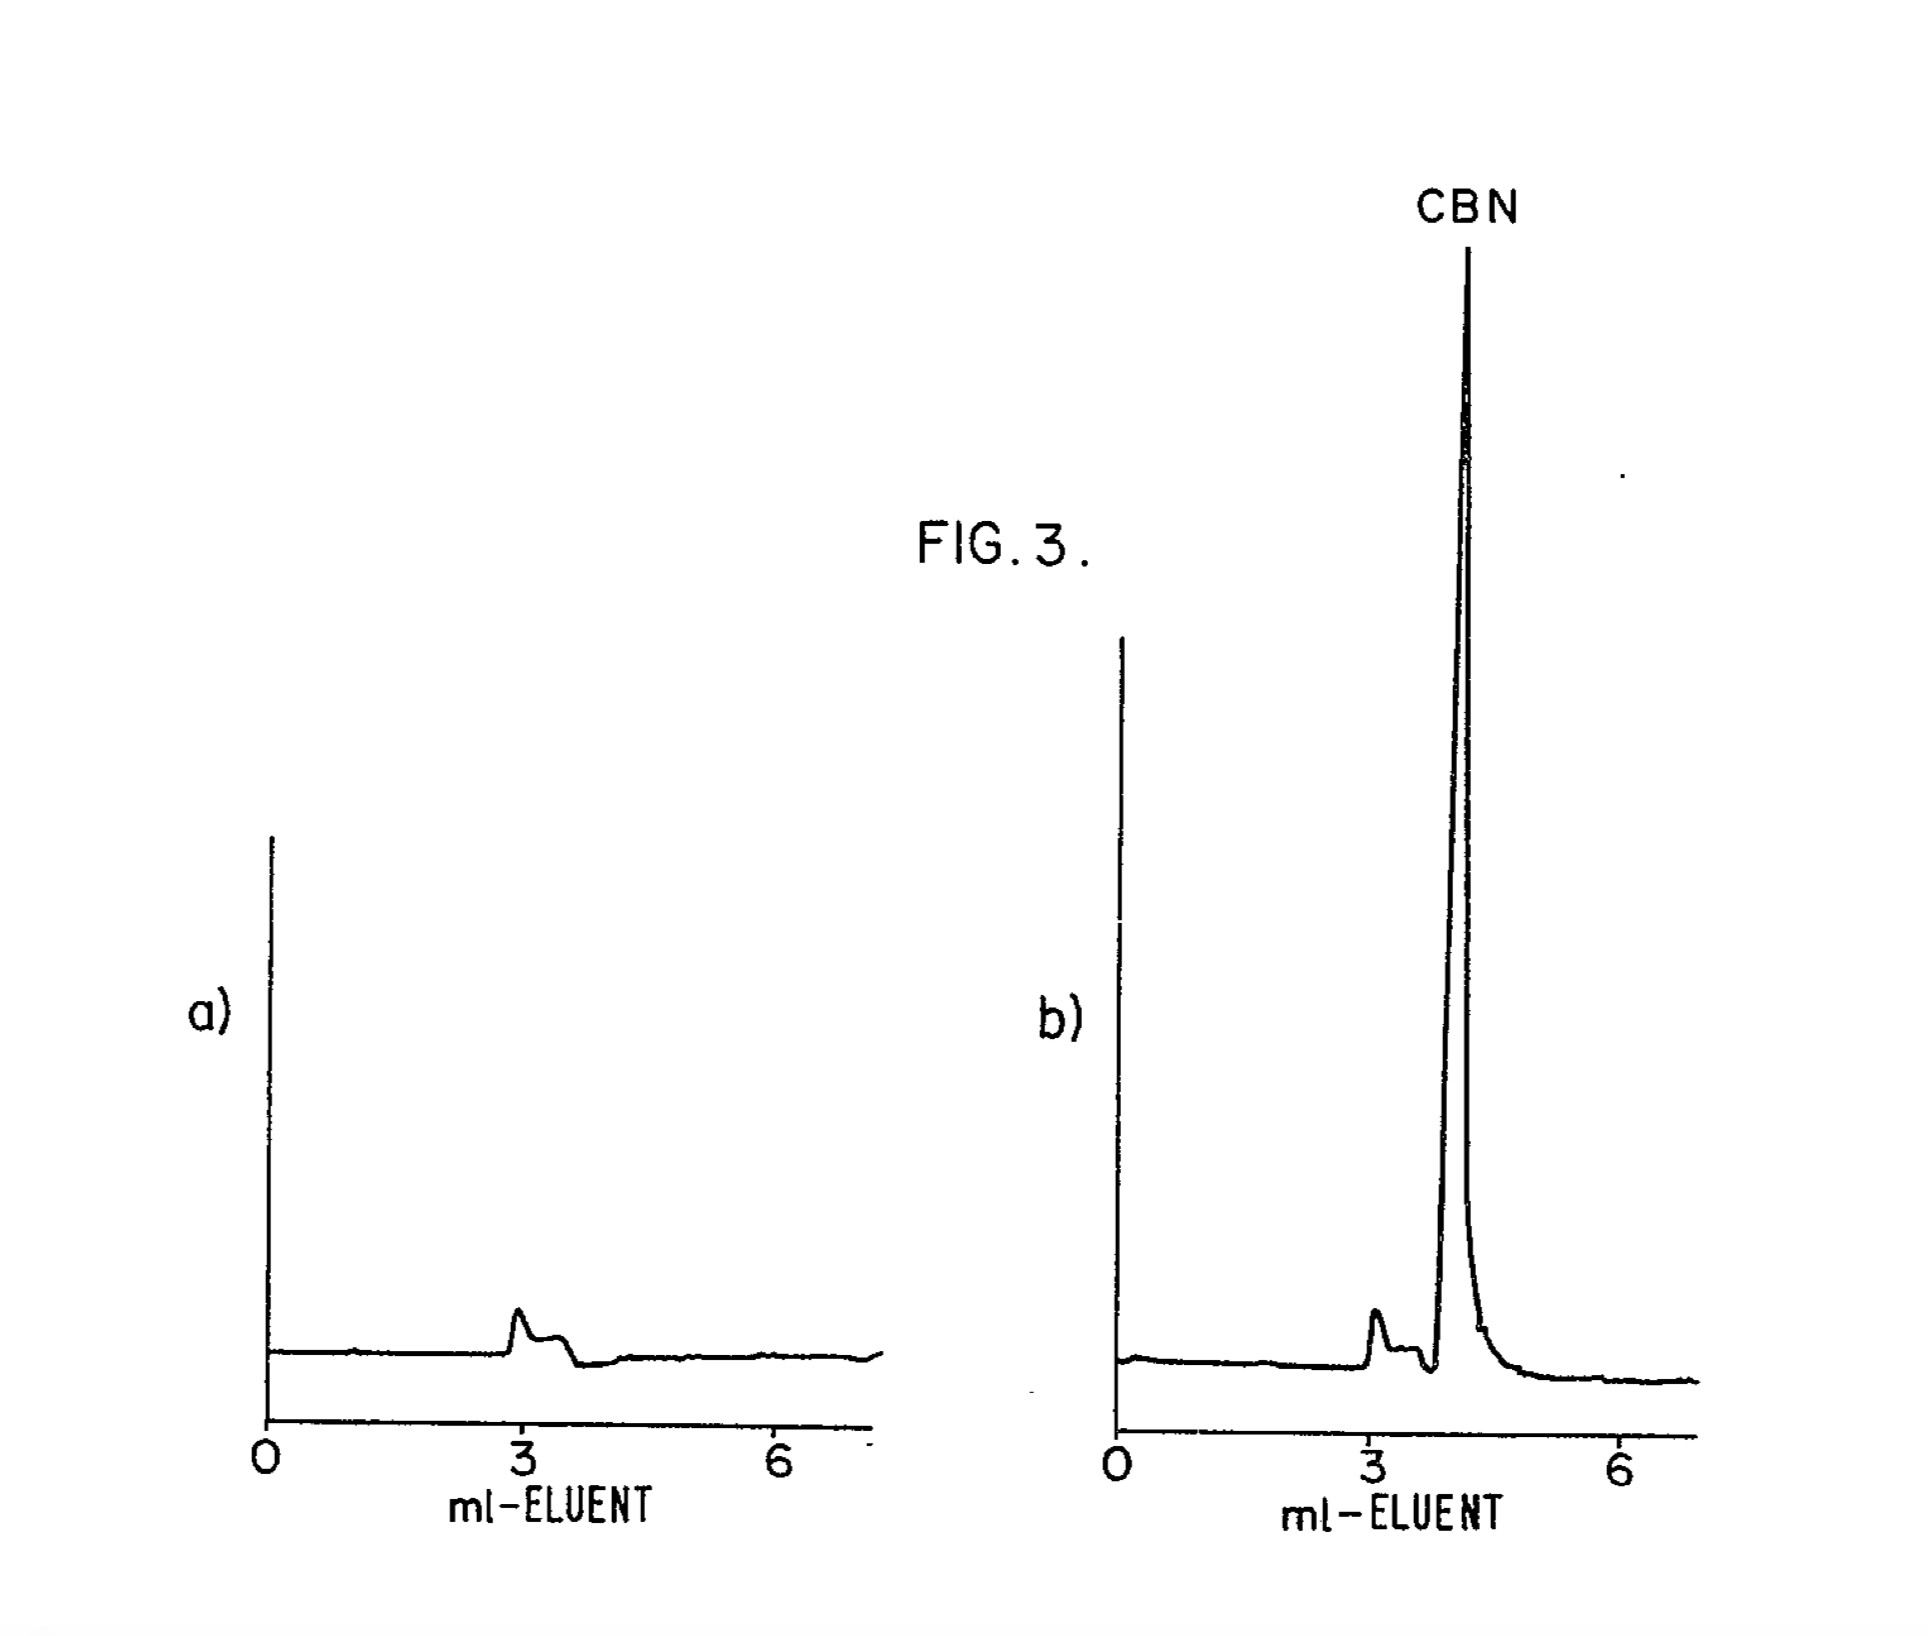
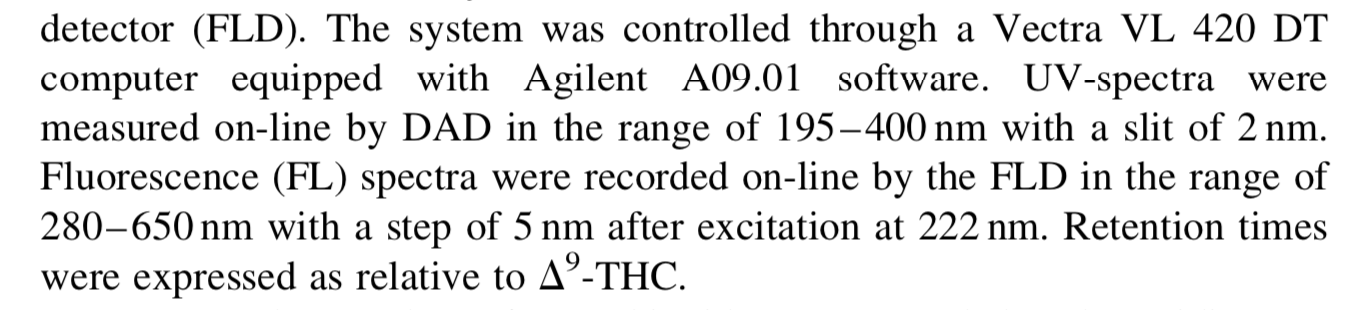
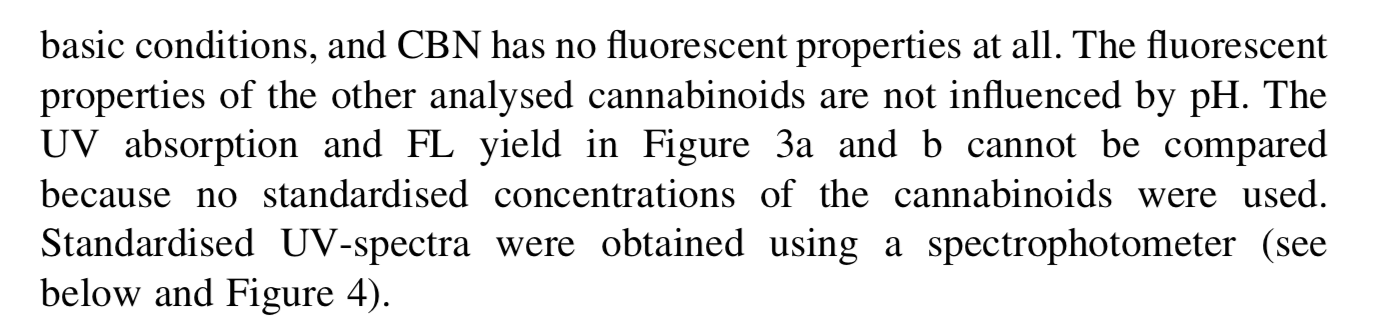
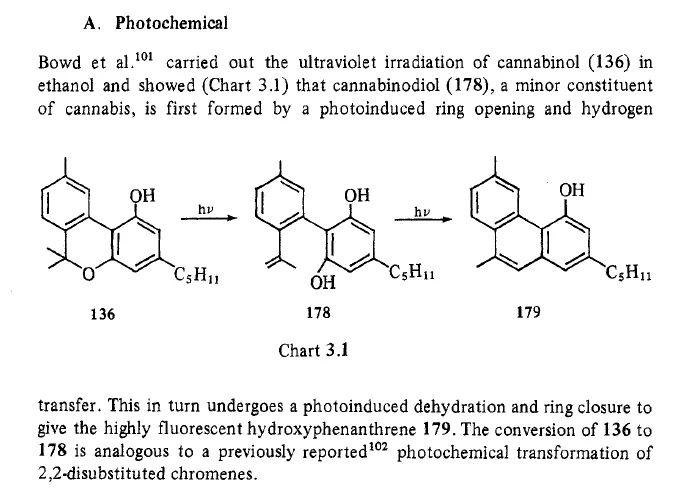
In the cannabis industry many people want to use fluorescent spectrometers to detect cannabinoids. Unfortunately the Pigment Tracker does not detect cannabinoids. Until cannabinoids are exposed to oxygen for extended periods or heated, they do not produce a fluorescent light. This is a paper which addresses the process to create a fluorescent response in non-fluorescent cannabinoids https://academic.oup.com/jpp/article-abstract/27/2/135/6196033?redirectedFrom=PDF

Because no one heat is treating their samples in the way described we do not recommend using the pigment tracker (or any fluorescent spectrophotometer) to detect desirable cannabinoids. The realization that degrading THC creates a fluorescent compound may be useful to test for degradation in very pure samples.

Next Post: how to use the pigment tracker for cannabis processing

25 Likes

Love to see solid analytical science making it to the industry…

7 Likes

Shown here are dilutions of some fresh oil under visible light. I took some of the high pigment oil and low pigment oil and mixed it at the following dilutions from left to right. 20:0, 18:2, 15:5, 10:10, 5:15, and 0:20.

If they were mixed up could you put them in order?

Under visible light it’s difficult to see the differences. With a UV light the differences become more apparent.

With a Pigment Tracker the differences in pigment concentration become obvious and can be recorded for sharing and future reference.

Note: the peak shape of chlorophyll is distorted in these images, likely due to the unusually high concentration. Usually chlorophyll is shown as a doublet. The next post of this type will detail what these spectra look like when the concentration of chlorophyll is much lower.

14 Likes

They are mildly fluorescent, however, pretty much all cannabinoids look the same when excited with a 370nm source. Where UV really shines with cannabinoids is with absorbance spectroscopy. Here there are extreme differences between the molecules but the wavelength is very short (180-300nm).

This was our motivating factor to choose white light when we developed our distillation sensor a few years ago. Since no two molecules have a perfectly identical absorbance spectra, this was decided to be the best method of analysis. Not to mention, this is how we study far away planets.


11 Likes

I think your sensor will be very valuable in the industry. Definitely looking forward to checking it out in a couple weeks. Pigments are the current “problem” and you made the perfect tool to seek them out.

8 Likes

This is essentially the paper that the Arometrix tech is based on. It’s odd because in that paper they don’t record the concentration of the cannabinoids anywhere. That makes this data nearly impossible to repeat. Maybe I’m missing the data

It’s not in the literature much but when cannabinoids are processed with alcohols they seem to degrade into colored and fluorescent compounds. I’d argue that the fluorescence data coming off of a column or from a standard sitting in alcohol is interesting but only a starting point. Better data comes from a pure sample of D9 or a pure sample of CBD immediately dissolved and tested in a solvent that doesn’t cause degradation (heptane/limonene).

If there is a weak fluorescence, it is much weaker than the pigments. In my experience if it is there, it will be covered up nearly always by even a tiny amount of the plant pigments.

6 Likes

More than likely the presented data was normalized to 1 so everything looks right even at various concentrations. This would definitely make it difficult to get the exact same results because the source has been altered. (Evidenced by all examples range between 0% and 100% on the graph)

I too have seen reactivity as well with cannabinoids in ethanol. Always just assumed it was because of the hydroxyl bond of the ethanol getting some work done.

I agree, any fluorescence from the cannabinoids would easily be covered up by the pigments. Plus I don’t think 370nm is a short enough wavelength to initiate proper emission… Needs to be closer to 300nm as the cannabinoids themselves appear to land between 320nm and 350nm (neutral).

3 Likes

Found this little gem a while back… It is the absorbance spectra of common plant pigments. The interesting aspect is the absorbance spectra tends to also be the emission spectra. So this is kindof a road-map to the pigments detected by your sensor. :love_you_gesture:

9 Likes

Continuing the discussion on the fluorescence of the cannabinoids, here is an old paper which shows that fluorescence of CBN can be induced by simply shining a strong UV light at a sample.

Here is a patent the author filed based on the same idea, where fluorescence can be induced by a UV light. It includes some of the figures from the paper.
https://patents.google.com/patent/GB1570236A/en?oq=GB1570236A


The chromatography done in this patent and paper are likely (hopefully) a lot more crude than the chromatography done by Hazekamp. However, these papers confirm what we have observed: there is something happening to cannabinoids where fluorescence can be induced. I would suggest that Hazekamp probably didn’t control for all of the things that can induce fluorescence (heat, UV, oxygen, alcohol, etc).

3 Likes

be nice to have some electron spin resonance on the excited species to see wtf is going on.

2 Likes

I should be more specific when I say that cannabinoids do not fluoresce. Cannabinoids do not fluoresce at 365nm excitation. There may be a higher energy wavelength that does cause some fluorescent effect but as shown in the previous posts, high energy light also can induce a fluorescent effect in cannabinoids.

I hadn’t noticed but like you say there is a major difference between the Hazenkamp paper and what the fluorescent detectors on the market are doing now.

Hazenkamp was using an FLD with an excitation of 222nm. Not 365nm.


222nm light is significantly higher energy light than the UVa excitation in the Pigment Tracker.

On repeatability of the data he says this:

So the conclusion I have is that the Hazenkamp paper is actually not comparable to the situation we’re dealing with in the Pigment Tracker. He may have observed a situation where the cannabinoids were fluorescing or he may have been manipulating the molecules unknowingly by detecting with a DAD (UVc light) and then detecting with an FLD using even more UVc light.

1 Like

When CBN is in ethanol and bombarded by UV light, it will slowly isomerize into CBND and that can further isomerize into a highly fluorescent byproduct.

If made from CBD you will get CBF as the byproduct instead, which can proceed further and become CBX. The gc peaks then shift to the right side of CBN indicative of the furan, as to the left of CBN is indicative of CBND.

Went down that rabbit hole last year. Made a little CBND and a ton of CBF. Have a 15 standard library including CBND but not CBF. It was identified via literature.

3 Likes

If this is happening with d9 processing the intermediate would also be CBD. Going to check our samples of the red ring/crust for cbd.

4 Likes

I have always seen the red ring to be from oxidation and is most likely a quinone. Although slow, it likes to float to the top when mixed in (loss of hydrogen). If the pH is shifted acidic, does it go away? (gain of hydrogen). Think of it as the hydrogens of THC are reacting with the oxygen of air to form water vapor. Thus, refrigerated preservation would slow the oxidation rate and freezing should stop it completely.

With a GC and in my case, a rxi-35-sil column, CBND lands to the left of CBD and the right of THCv. CBF however, lands to the right of CBN.

In order of retention:
Olivetol, methyl sterate (internal), CBDv, cbt, d8THCv, d9thcv, CBND, d8 acetate, CBD, unk (exo-cbd?), exo-thc (d11), d106a, d10, d8, cbe, d9, cbg, CBN, CBF, CBX.

The unknown peak is created when CBD is reacted with an acid, the standard cbd peak splits into two peaks. As the original peak shrinks, the new one grows, and as the new peak shrinks the new isomer grows (d8/d9/etc.). I have sampled reactions every 10 minutes and watched the transition take place.

Naturally, varins will be earlier in time and phenols later in time to the standard cannabinoid set. Typically following the same standard order.

I have some hhc but haven’t ran it through yet to see where it lands. Have been focused on rebuilding a waters mass-spec so I can setup as a gc-ms / lc-ms.

D9 will likely go to CBN then CBND, whereas CBD skips CBND and goes directly to CBF. Looking at the molecules you would think there should be a short-cut if you start with CBD. The only time I have gotten CBND was with CBN as the source.

9 Likes

Great info thank you!

3 Likes

Just about every reaction we do with cannabinoids involves either the addition or removal of hydrogen. Removal creates an oxidized product and the addition creates a hydrated product. So I would say the red is relative to lost hydrogen at the surface and nothing more. By removing the hydrogen, the molecule naturally becomes oxidized and quite likely transitioned into a quinone.

Freezing prevents/slows oxidation. I have some d8 that has been open to the air but in a freezer for over a year and has not a hint of red at the surface.

Re-acidification should return it to the original color as the hydrogen that was lost is replaced by the acid.

This is CBDa-HQ. It is a true water soluble form of CBDa that uses no emulsifiers. If I start with 100% CBDa, I will get 100% CBDa-HQ. As a quinone, it takes on color, in this case a dark purple. THCa is more of a reddish color, almost identical to the red ring.

Both acidic and neutral cannabinoids can form a quinone.

21 Likes

Can you make the D9-hydroxy quinone with high yield?

In my experience the red line in d9 can be caused by a lot of different things but it doesn’t seem to be water soluble. It seems to happen when any amount of oxygen is there.

Big CBN crystals seem to be entirely non-fluorescent and stable in crystal form.
I’m going to aim a strong UVa light at a CBN crystal to see if it turns red and fluorescent. I will also melt some CBN crystal down and check to see if it develops the fluorescent red line in amorphous form.

Then I’ll try diluting the CBN in ethanol, THC, CBD etc to see if any of those have an effect.

2 Likes

There are high yield methods for acidic and some neutral molecules. Neutral cannabinoids (disty) are not water soluble but will change color.

I have tried a few ways of getting to CBND - with CBN + UVc in ethanol was the only success. THC in ethanol over time will turn red, which I have always believed is because of the hydroxide of ethanol doing the same process and stripping hydrogen.

Going down the o-chem rabbit-hole it gets interesting.

3 Likes

The Pigment Tracker will be at the @SolventDirect booth at Cannacon! The booth number is 323.

Thank you to @SolventDirect_BigM for being willing to push this technology forward! Check it out if you get a chance

15 Likes

The Pigment Tracker will be at CannMed in Pasadena May 4-5!

Also thank you to @SamboCreeck.com for listing the Pigment Tracker online! Pigment Tracker UV Fluorescence Spectrometer | SC Filtration

4 Likes